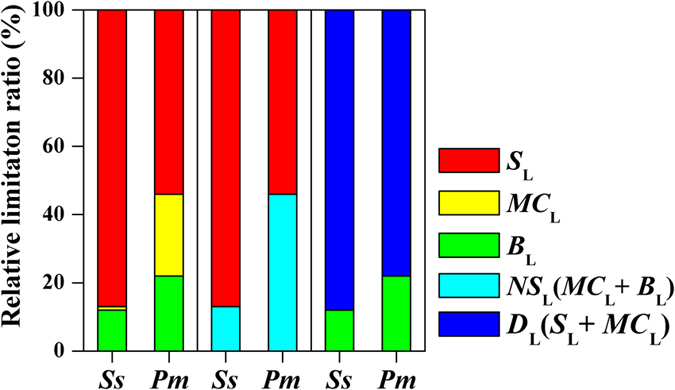
Figure 3. The quantitative limitation of An (net CO2 assimilation rate, μmol CO2 m−2 s−1) for Schima superba (Ss) and Pinus massoniana (Pm) during drought stress.

The stomatal limitation (SL, red area), mesophyll conductance limitation (MCL, yellow area) and biochemical limitation (BL, green area) are shown. The total diffusional limitation (DL = SL + MCL, blue area) and the non-stomatal limitation (NSL = MCL + BL, sky blue area) are also indicated.
