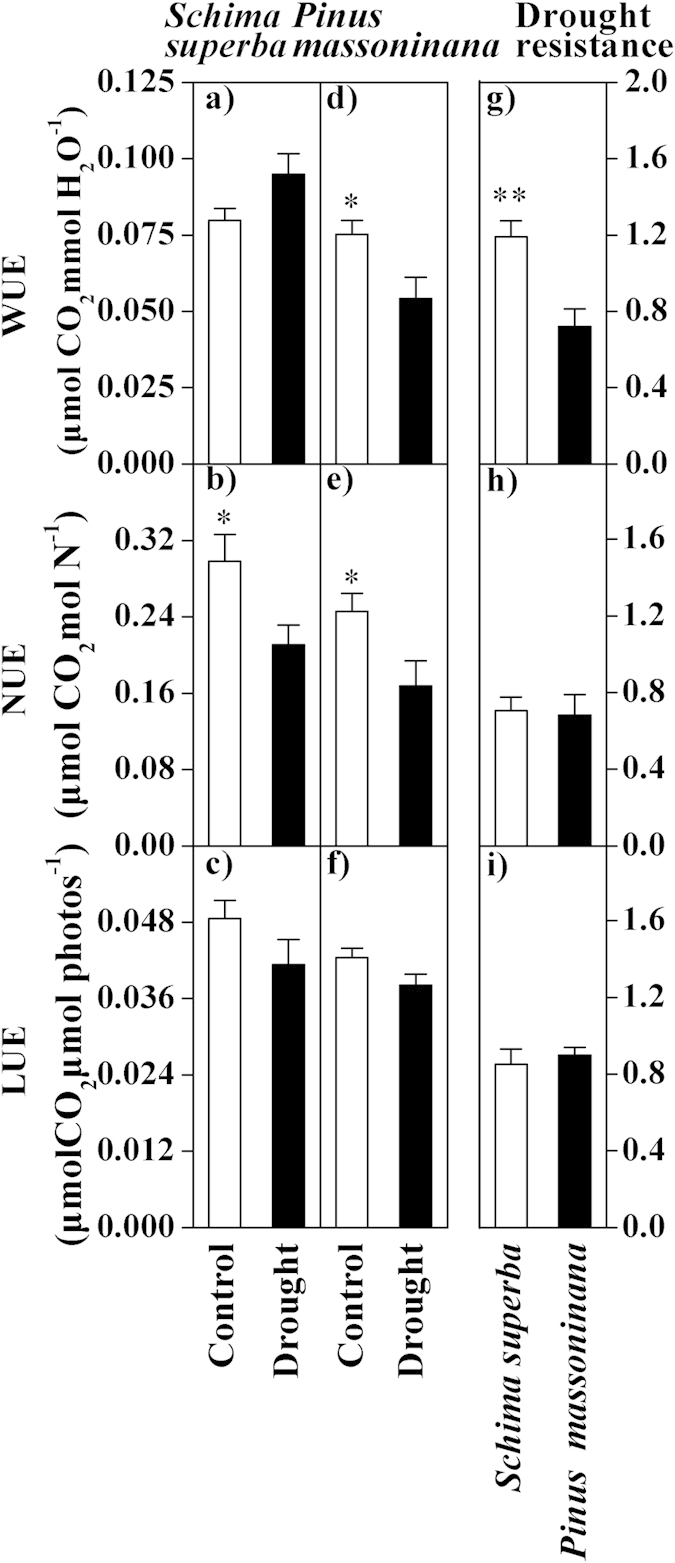
Figure 4. The effect of drought on the resource use efficiency for the two species.

(a,d) The iWUE (the water use efficiency, μmol CO2 mmol H2O−1), (b,e) NUE (the nitrogen use efficiency, μmol CO2 mol N−1) and (c,f) LUE (the light use efficiency, μmol CO2 μmol Photons−1) in the control and drought plots of Schima superba (a–c) and Pinus massoniana (d–f) are shown. The drought resistance of the (g) iWUE, (h) NUE, and (i) LUE in Schima superba and Pinus massoniana is indicated. ANOVA: *P < 0.05; **P < 0.01; and ***P < 0.001.
