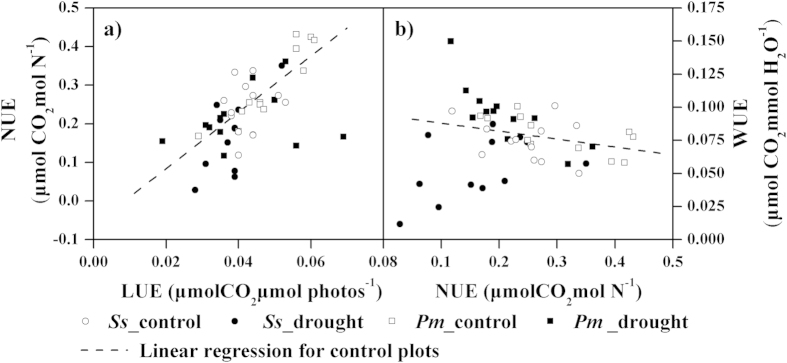
Figure 5.
The relationships between the LUE (light use efficiency, μmol CO2 μmol Photons−1) and NUE (nitrogen use efficiency, μmol CO2 mol N−1) (a) or the NUE and iWUE (water use efficiency, μmol CO2 mmol H2O−1) (b) in the control and drought plots. Ss and Pm represent Schima superba and Pinus massoniana, respectively. The dotted line indicates the linear regression for the control plots.

