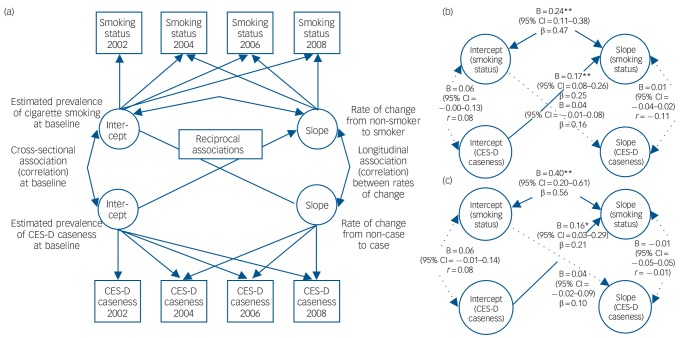
Fig. 2.
Multivariate parallel latent growth curve model: (a) conceptual model, (b) minimally adjusted model and (c) fully adjusted model.
CES-D, Center for Epidemiologic Studies Depression Scale; double-headed arrows indicate correlation coefficient paths (r), single-headed arrows indicate probit regression coefficient paths (β); latent variables in circles, observed variables in squares; broken line indicates non-significant paths. Fit data: Model in figure part b (n = 2359) – RMSEA (90% CI): 0.000 (0.000–0.015); CFI: 1.000; TLI: 1.000; χ2(29) = 28.6, P = 0.486; Model in figure part c (n = 1900) – RMSEA: 0.010 (90% CI = 0.000–0.017), CFI: 0.999; TLI: 0.997; χ2(81) = 95.0, P = 0.137; see Table 2 for corresponding covariate coefficients of fully-adjusted model; *P<0.05, **P<0.01.

