
Figure 2.
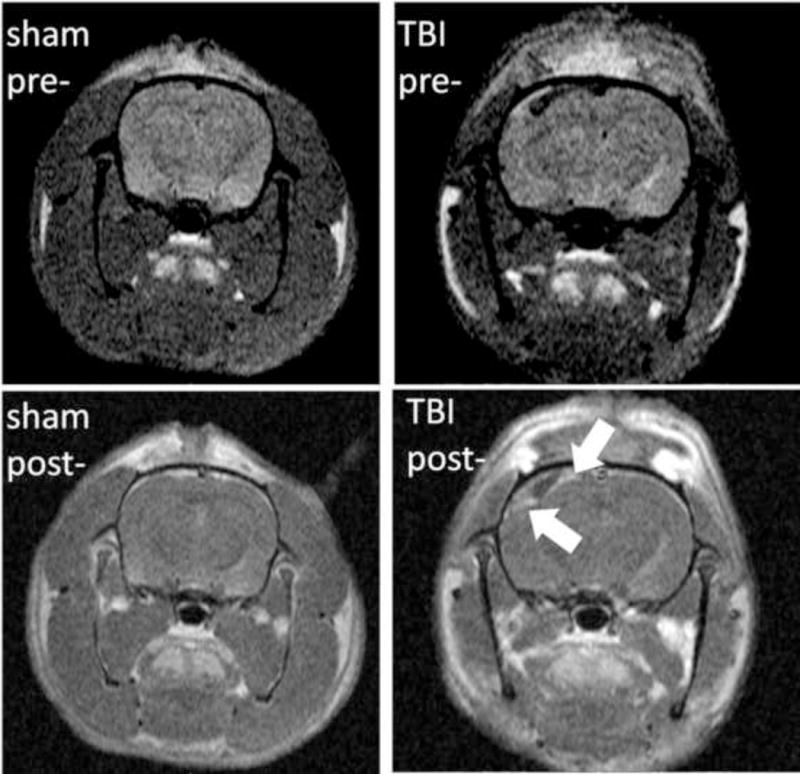
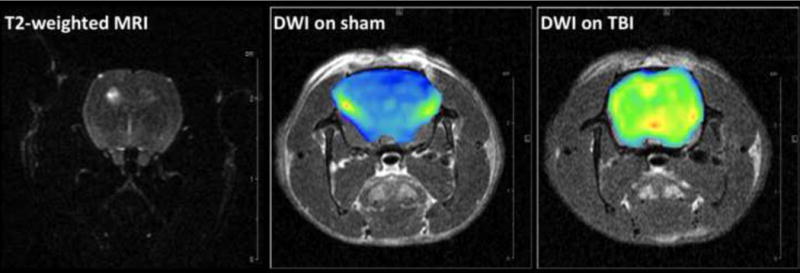
Representative T1-weighted pre- and post-contrast images (A) and DW images (B) from one sham and one injured animal at 72 hrs after FPI. (A): T1-MRI after gadolinium injection (0.2 mmol/kg) shows homogenous distribution in the sham animal with no hyperintense areas (left column) since gadolinium chelates cannot cross the BBB. In the injured animal, a significant accumulation of gadolinium in injured cortex can be observed in the post-contrast image (right column) due to BBBD and leakage of gadolinium into the brain tissue (blue arrows). (B): T2-weighted MRI (where b values are 0) and generated brain DW images (from 6 b-values) as color diagrams overlying anatomic T1-MRI. The sham animal is represented with homogenous low-intensity DWI (corresponding to higher ADC values); while a significant areas of hyperintensity are visible in the injured animal.