Fig. 2.
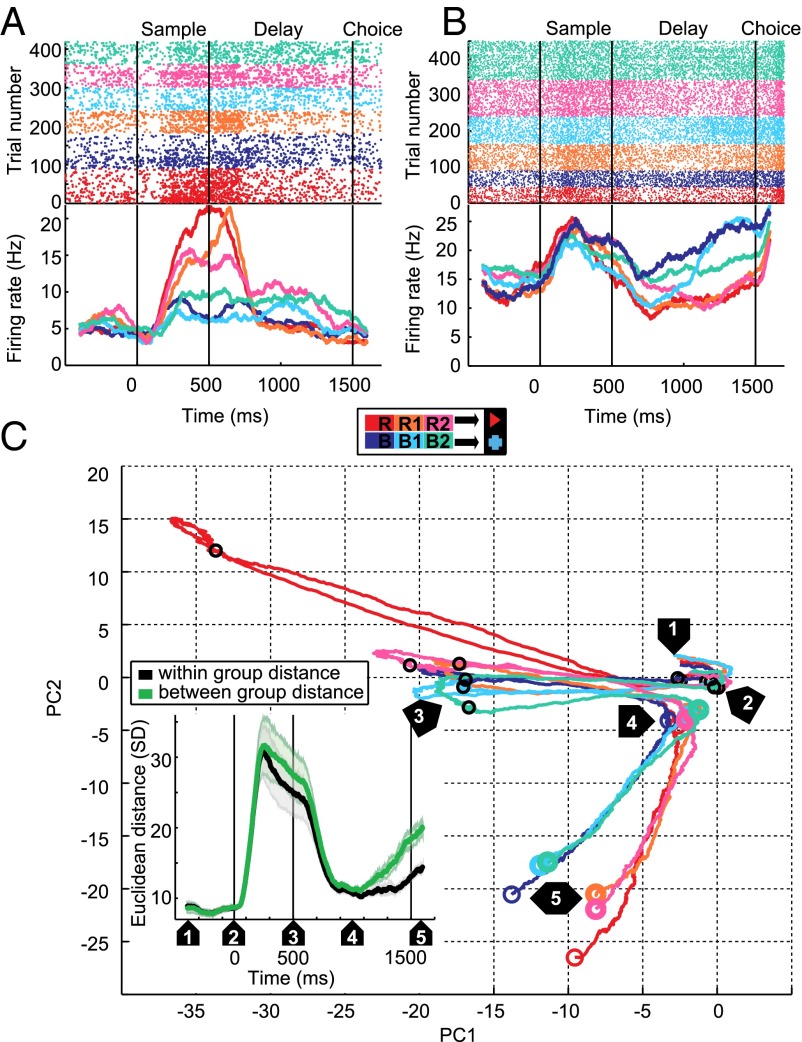
Associative activity was a prominent feature in the recorded population of single neurons. (A) Example neuron that discriminates between samples based on the associated test item (red or blue). (Upper) Dot raster showing the neuron’s response in individual trials, ordered by blocks and sample item (R, B familiar block; R1, B1 first novel block; R2, B2 second novel block). (Lower) Peri-stimulus time histogram (PSTH) obtained by averaging the dot raster and smoothing with a 200-ms boxcar window. Time 0 is sample onset. Responses from both familiar blocks are pooled. (B) Example neuron preferring all sample stimuli associated with the blue test item in the delay period. (C) Pseudo-simultaneous population response, visualized using PCA. Only the first two principal components are shown. Activity is shown from the start of the presample period (“1”) until the beginning of the choice period, as in the PSTHs in A and B. Small black circles mark the onset (“2”) and offset (“3”) of the sample period, large colored circles mark the onset (“4”) and offset (“5”) of the analysis window in the second half of the delay period, designed to capture associative activity. The Inset shows average Euclidean distance between different activity patterns in the high-dimensional space, grouped by sample pairs associated with the same test item (within group distance) and samples associated with different test items (between group distance).

