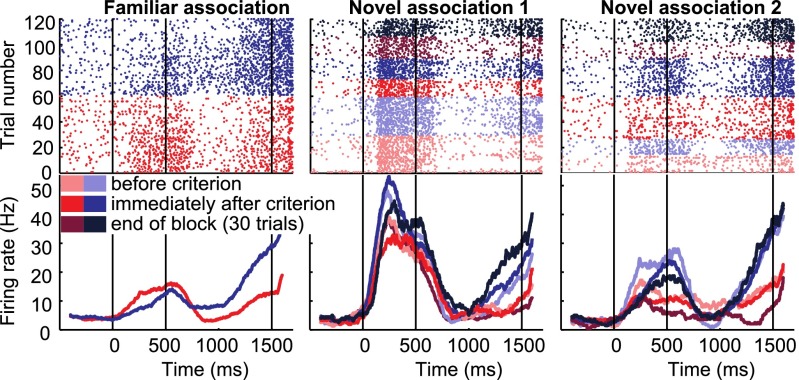
Fig. 3.
Association-selective example neuron. Example neuron preferring the sample associated with the blue test item in the delay period of each block. Red and blue colors indicate different associated test items, shading represents different periods within the novel blocks. Vertical lines mark the onset of the sample (0 ms), delay (500 ms), and test periods (1,500 ms).

