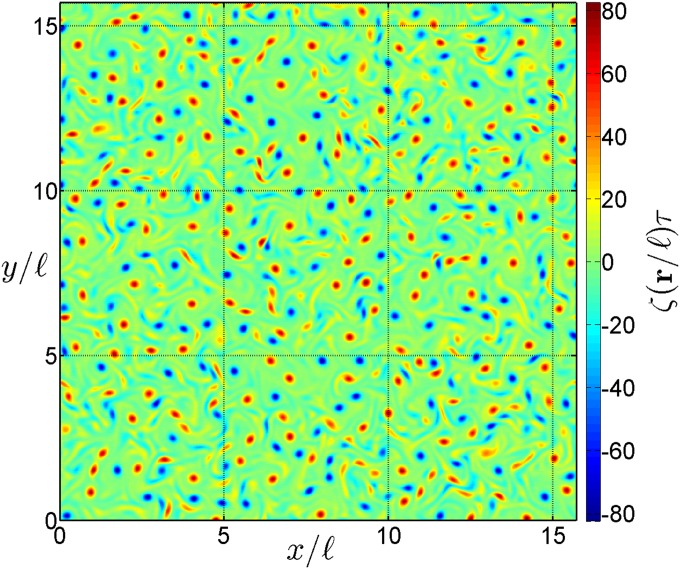
Fig. 1.
Snapshot of the 2D vorticity field right after the onset of the turbulent regime as obtained from a numerical solution of Eq. 1, using a pseudospectral code. The computation has been performed with 1,024 (effective) points in each direction under the constraint of periodic boundary conditions. The Ekman parameter equals , implying that there are two energy sources acting at large scales—the two positive terms in the expression for . The strength of the cubic nonlinearity is set to and for the advective term we have used . One can clearly see the highly disordered distribution of vortices justifying the classification of the regime as turbulent.

