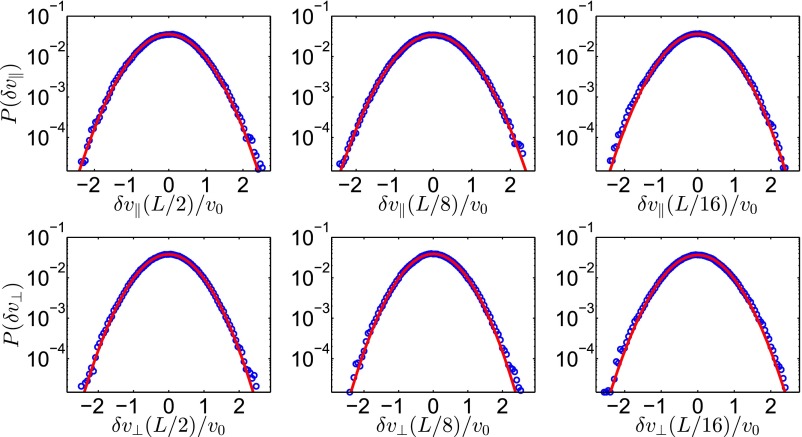
Fig. S3.
Numerically computed probability density function (blue circles) for the longitudinal (Upper Row) and transverse (Lower Row) velocity increments for three different separations: (Left Column), (Center Column), and (Right Column), where L denotes the box size of . Here the Ekman parameter equals . The red line gives the closest fit of a Gauss distribution. The statistics of the velocity field at large scales are again very close to Gaussian.

