Fig. 2.
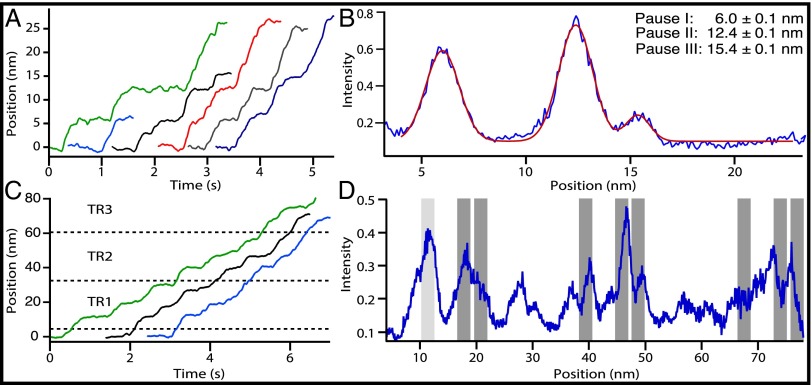
RNase R pauses at specific sites as it unwinds dsRNA. (A) Six representative single-molecule records of RNase R activity on the 155-bp dsRNA construct. (B) Positional histogram of aligned RNase R records (blue curve; n = 13). Peaks indicate pauses by RNase R. Data are fit to a sum of three Gaussians (red curve). The legend gives the three main pause locations (mean ± SE). (C) Three representative single-molecule records of RNase R activity on a 1,500-bp dsRNA construct carrying three tandem repeats (TR1–TR3) of the 155-bp sequence (Fig. S2). Approximate beginning and ending locations for each repeat are indicated (dashed lines). (D) Positional histogram of aligned RNase R records (n = 18) for the 1,500-bp construct (blue curve), including data from molecules that did not fully traverse the region (Materials and Methods). The predicted locations of pauses within the repeats are indicated (dark gray bars); these records were left-aligned at the measured location of the first pause (light gray bar at 11.4 ± 0.3 nm), which was found within 1 nm of its predicted location, at 10.5 ± 0.1 nm. The widths of the gray bars (2.0 nm) correspond to the approximate widths of peaks in the pause distributions.

