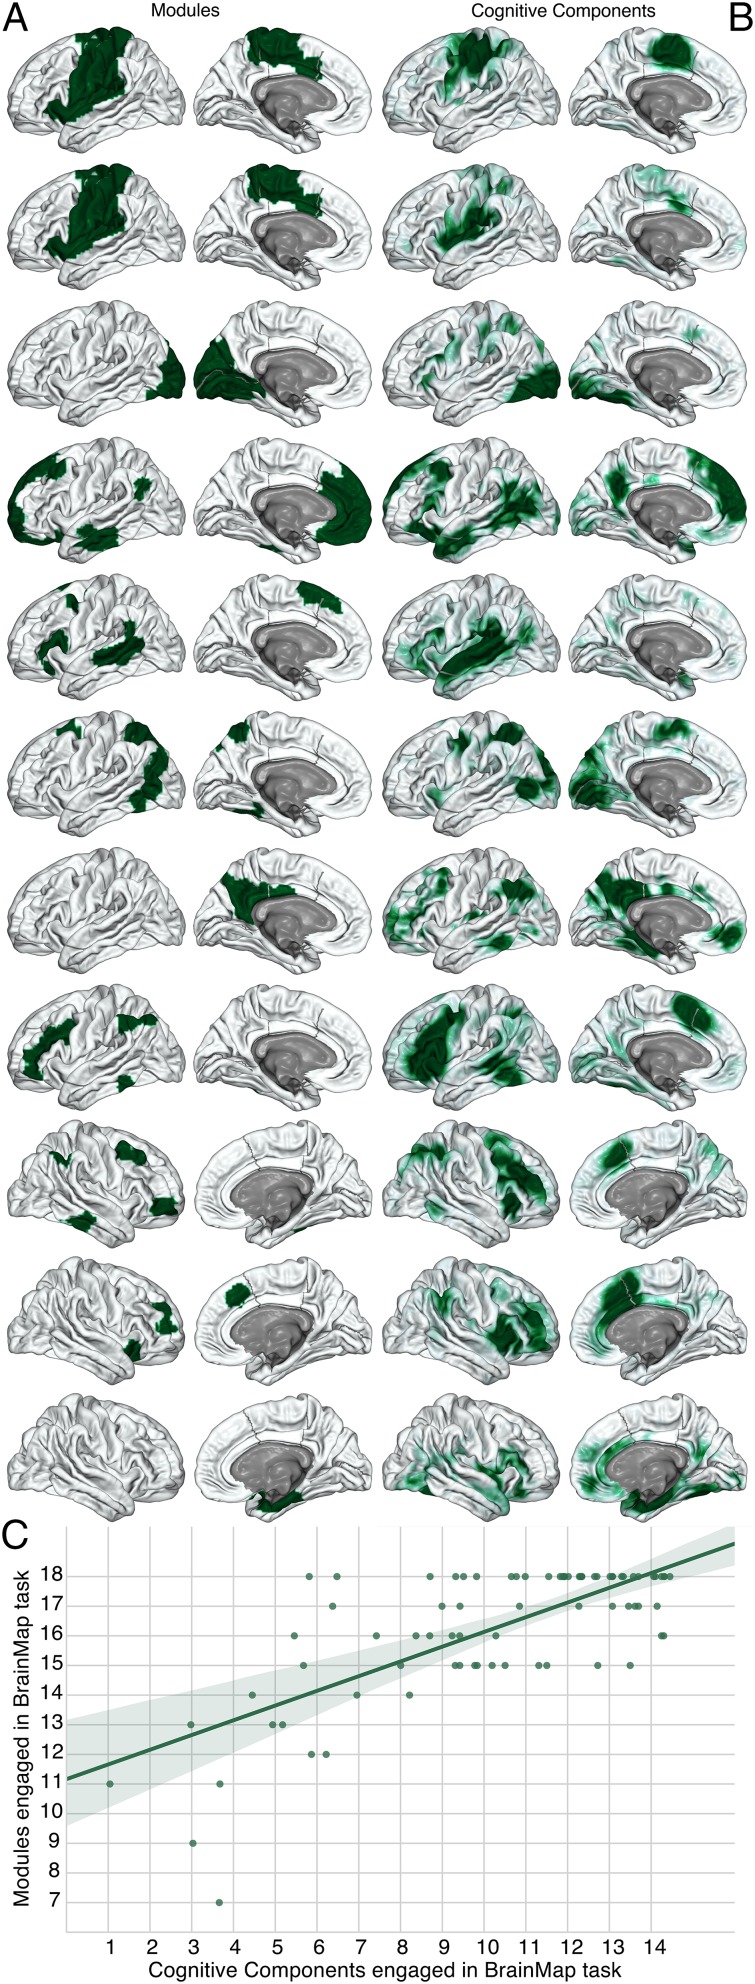
Fig. 2.
Spatial distribution of network modules and author–topic cognitive components. (A, left column) Modules derived from spontaneous neural activity measured via rs-fMRI with graph theory. (B, right column) Cognitive components derived from the BrainMap database with an author–topic model. Each row comprises a unique module and the cognitive component with the highest probability of activity at voxels in the module. However, the module on the first two rows is a duplicate of the same module, as two different cognitive components had a high probability of activating voxels in it. The spatial distribution of network modules and cognitive components in subcortical regions are presented in Fig. S1. All modules with more than 5 nodes are shown, with the cognitive component that has the highest probability of activating voxels in the module on the same row, to the Right. As a default, the left hemisphere is plotted, unless the module or cognitive component was predominantly located in the right hemisphere. This figure illustrates the high level of shared spatial distribution between modules and cognitive components. (C, Lower) The correlation between cognitive components engaged and modules engaged in each BrainMap task. Each dot represents a BrainMap task. The number of modules and cognitive components engaged in each BrainMap task is strongly correlated.

