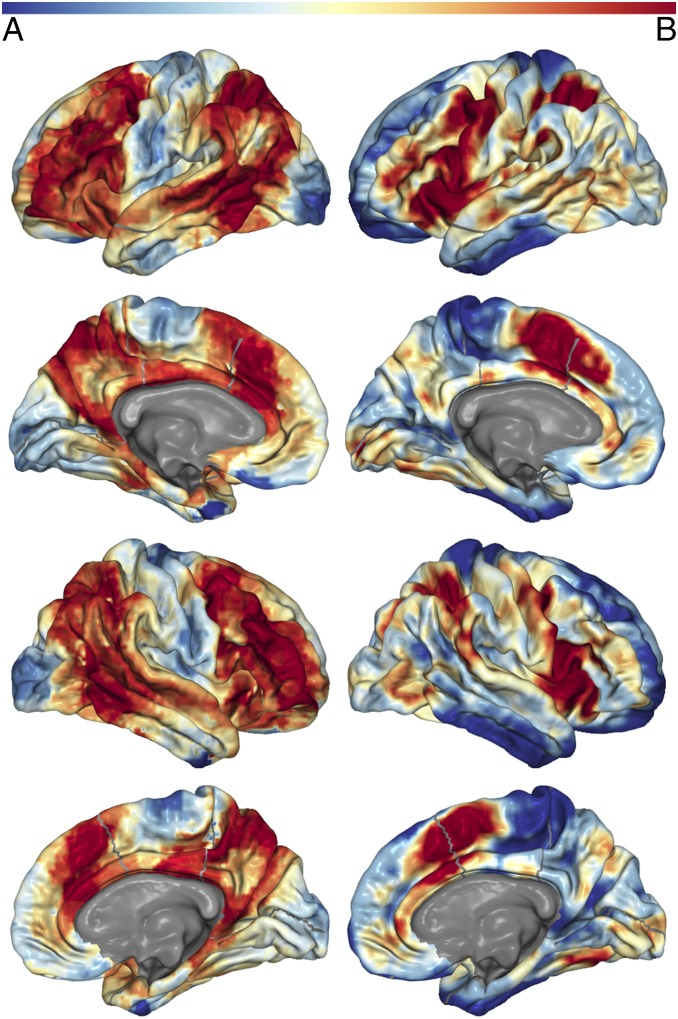
Fig. 5.
Spatial distribution of connector nodes and areas where many cognitive components have high probability of activity. (A, left column) The mean of each voxel’s participation coefficient across costs for all networks (i.e., atlases) that had coverage at that voxel (i.e., the calculation ignores 0 values if the network did not have a node that covered the voxel). These data are derived from the network model of spontaneous neural activity measured with rs-fMRI. (B, right column) The number of cognitive components that activity at the voxel is associated with above a probability greater than 1e-5. These data are derived from the author–topic model of BrainMap. The color bar is shown at the Top. Values have been normalized to sum to 1 for an accurate comparison across models. Thus, darker red areas represent higher values for both metrics, with lower values in blue. The results from this analysis for subcortical regions is presented in Fig. S3.

