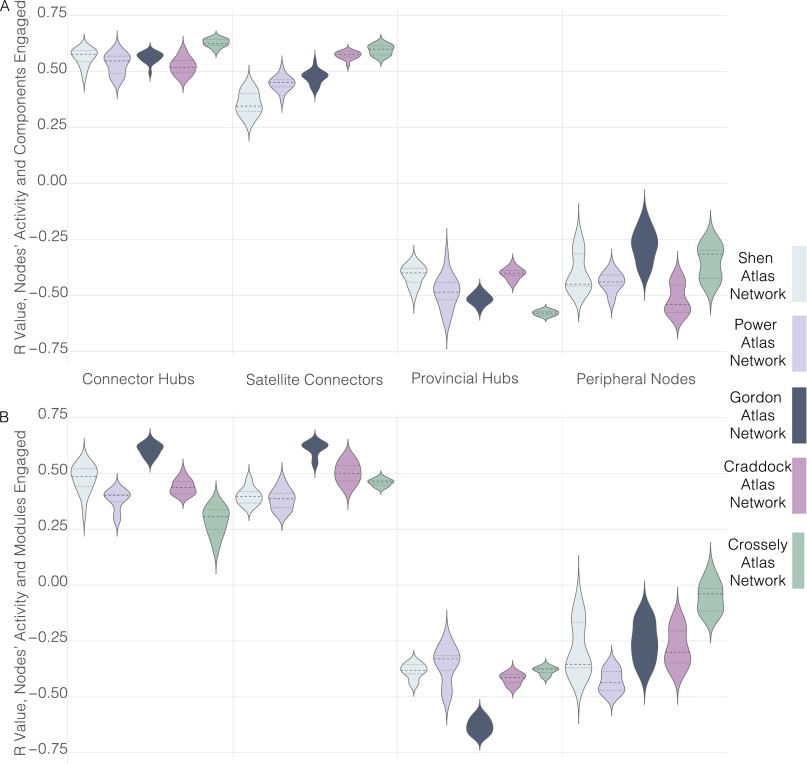
Fig. S2.
Correlations between different types of network nodes’ activity and the number of cognitive components (A) or modules (B) engaged in the task across atlases and datasets. A kernel density plot for each of the five brain networks and four types of nodes is presented. Each kernel represents results across cost thresholds, from 0.05 to 0.2 for the Shen, Power, and Gordon atlas networks and 0.01–0.1 for the Craddock atlas network. The median and the 25th and 75th percentiles of Pearson r values are shown in each kernel, with the median as the dashed line, and percentiles as a dotted line.

