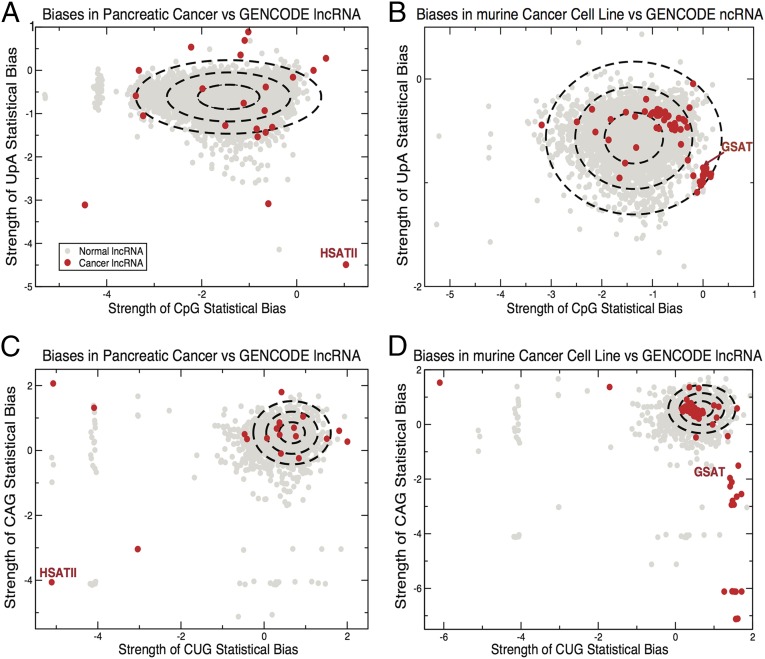
Fig. 2.
ncRNA from cancer cells contains outliers from normal motif use. Distribution of UpA and CpG bias in lncRNA taken from human tumors (A) and murine cell lines (B) (indicated in red) plotted against lncRNA from GENCODE (indicated in gray). Each ellipse indicates 1 SD from the mean value in the GENCODE dataset. The forces on CAG and CUG are also shown for human tumors (C) and murine cell lines (D).

