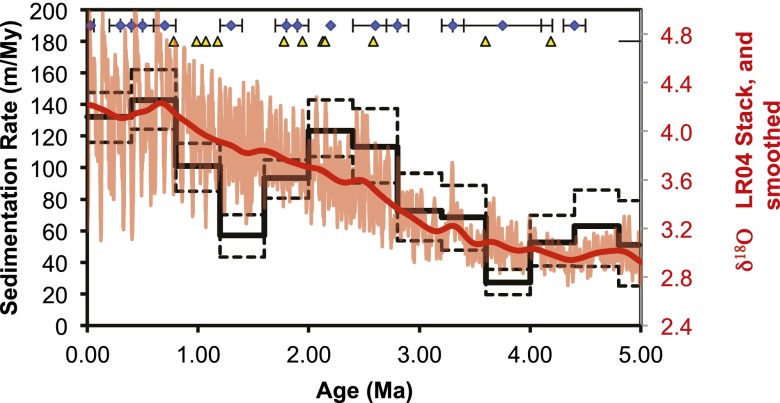
Fig. 4.
Sedimentation rates at Sites U1417 binned at 0.4 My. Dashed error bars are 1-sigma based on Monte Carlo simulations (see Methods). Note drop in rates after initial increase following the culmination of the iNHG (∼2.6 Ma) but sustained high rates since the MPT (∼1.2 Ma). Global δ18O curve (LR04) is shown in pink with a smoothed version (500-kyr Gaussian filter) shown in red to highlight long-term trends through this interval. Yellow triangles show paleomagnetic constraints, and blue diamonds show biostratigraphic constraints with age ranges.

