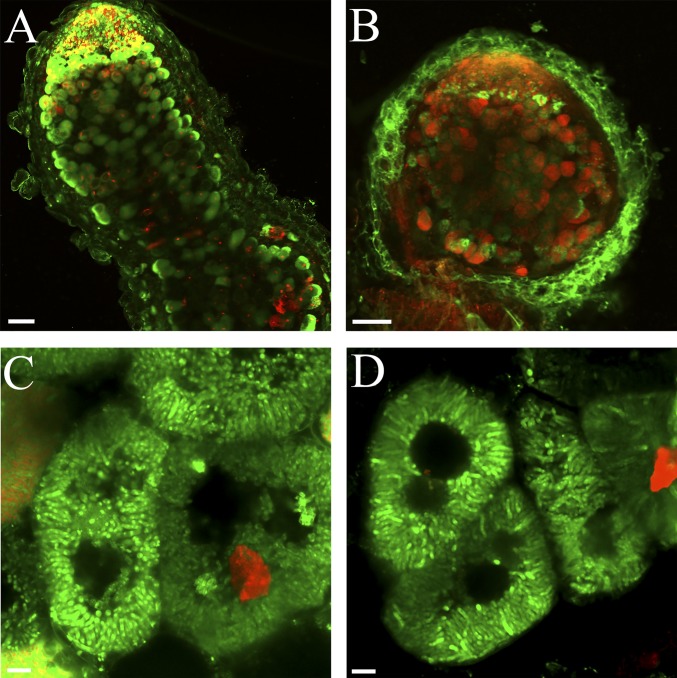
Fig. S1.
Live-dead staining of whole nodules with SYTO9 and PI. The procedures are similar to that used for Fig. 2D, except that the bacteria do not contain fluorescent proteins. (A and B) WT (A) and dnf4 (B) whole nodule sections. (Scale bar: 100 µm.) (C and D) Images of individual WT (C) and dnf4 (D) cells. (Scale bar: 10 µm.)

