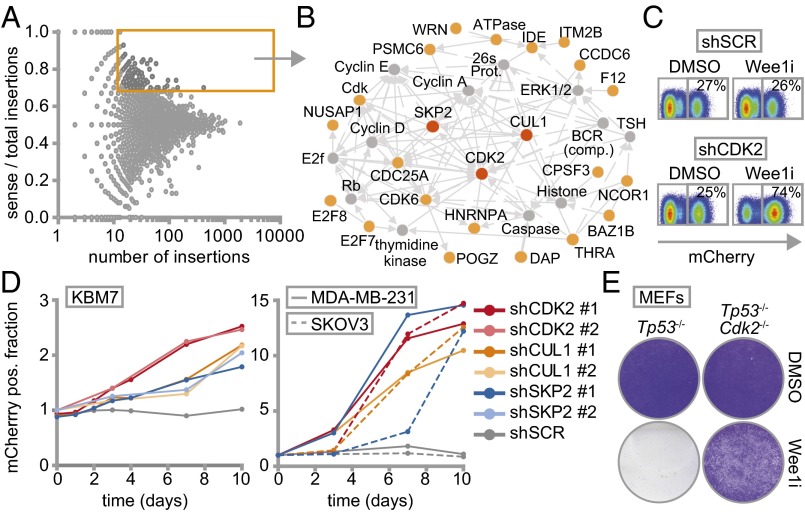
Fig. 1.
Haploid genetic screen identifies S phase genes as determinants of Wee1 inhibitor sensitivity. (A) Identification of gene-trap insertions enriched in sense orientation in MK-1775-selected KBM-7 cells. Y axis indicates fraction of gene-traps in sense orientation compared with total insertions. X axis indicates number of gene-trap insertions. (B) Network modeling with 142 genes enriched in sense orientation. Most significant module is shown. Red and yellow proteins were identified in the screen. Indirect (dashed lines) and direct interactions (solid lines) are indicated. Arrowheads indicate interaction direction. (C) Flow cytometric analysis of pLKO.mCherry transduced KBM-7 cells 10 d after MK-1775 (150 nM) or DMSO treatment. (D) Ratio of mCherry-positive cells of Wee1-inhibited vs. DMSO-treated KBM-7 cells (150 nM MK-1775) and MDA-MB-231/SKOV3 cells (1 µM MK-1775). (E) Nontransformed Tp53−/−,Cdk2−/−, or Tp53−/− MEFs were treated for 4 d with 500 nM MK1775 or DMSO, and stained with crystal violet.

