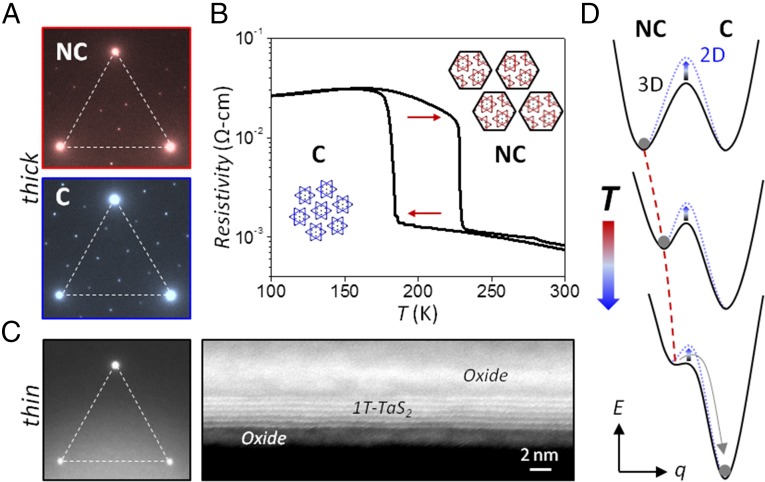
Fig. 1.
NC-C CDW phase transition in bulk 1T-TaS2 and CDW suppression by oxidation in thin flakes. (A) TEM diffraction images of 50-nm-thick 1T-TaS2 at 295 K (red, NC phase) and 100 K (blue, C phase). Weaker peaks are due to CDW distortion. (B) Resistivity vs. temperature of bulk 1T-TaS2 crystal around the first-order, NC-C transition. (Insets) Real space schematics of CDW structure. (C) (Left) TEM diffraction of few-layer 1T-TaS2 flake shows absence of CDW order. (Right) High-resolution, cross section electron microscopy image reveals presence of amorphous oxide. (D) Free energy schematic of CDW evolution with temperature. Vertical and horizontal axis represent free energy (E) and reaction coordinate (q), respectively. NC domains grow slowly upon cooling until abrupt transition into the C phase. Energy barrier increases in 2D samples protected from oxidation.

