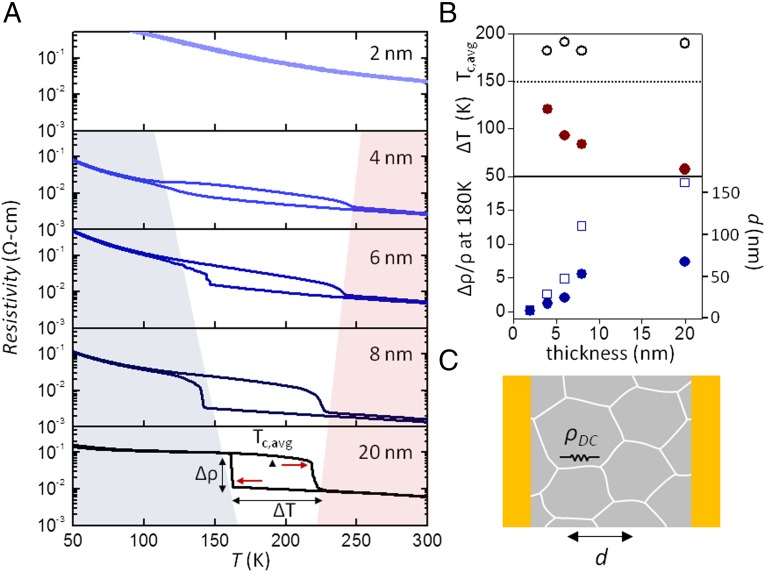
Fig. 3.
Dimensional dependence of phase transition—electron transport. (A) Thickness evolution of temperature-dependent resistivity around NC-C phase transition measured on hBN-covered ultrathin samples and 20-nm-thick flake. (B) Average transition temperature and temperature hysteresis (Upper) and normalized resistivity difference (Lower) between cooling and warming as a function of sample thickness. Open squares are corrections from contact resistance (Fig. S4). Hysteresis widens and resistivity difference decreases in thinner samples, whereas average transition temperature remains constant. Resistivity change can be used to estimate the discommensuration density 1/d at low temperature. (C) Circuit model of discommensuration network.

