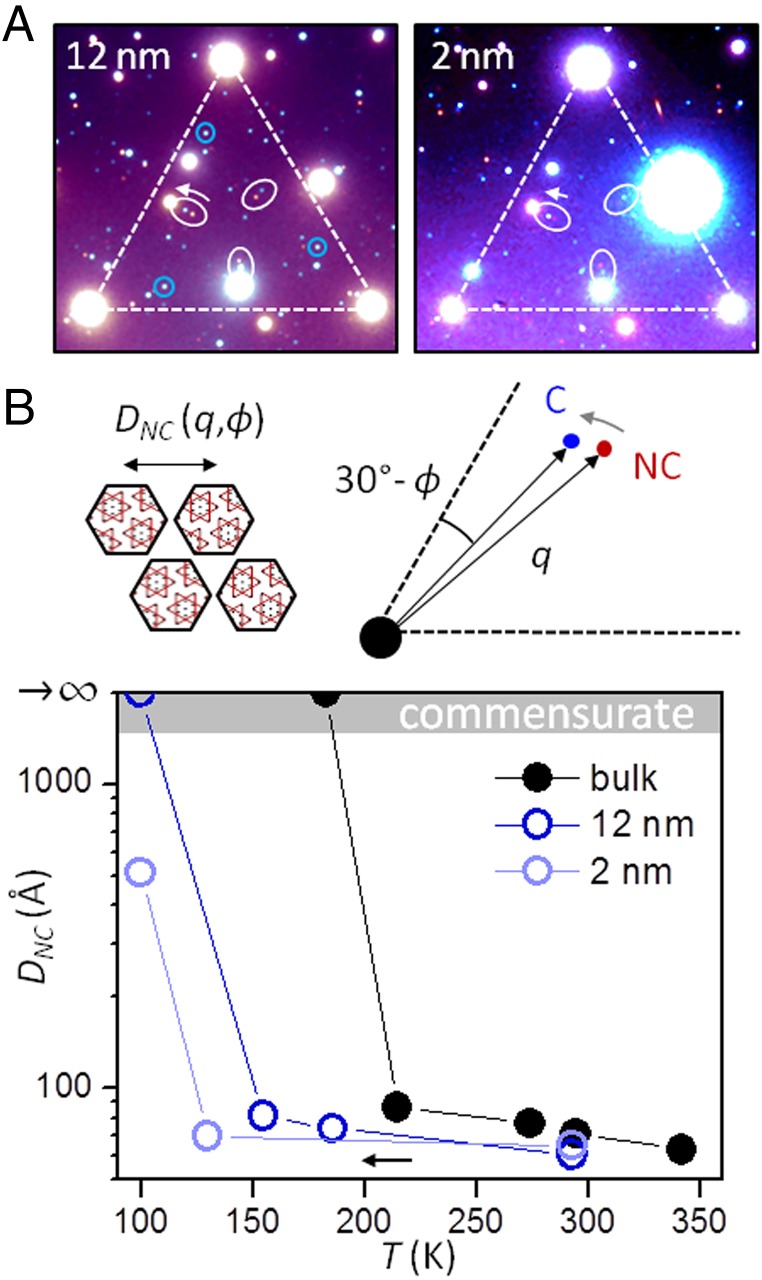
Fig. 4.
Dimensional dependence of phase transition—electron diffraction. (A) Overlaid TEM diffraction images of ultrathin 1T-TaS2 covered with hBN taken at 295 K (red peaks) and 100 K (blue peaks) for two flake thicknesses. hBN preserves CDW order (circled peaks) but introduces additional diffraction spots. (B) (Upper Right) Zoom-in schematic of CDW diffraction peaks showing temperature evolution. Position of NC spot can be used to estimate commensurate domain periodicity DNC (Upper Left). (Lower) DNC vs. temperature with cooling measured for the two covered samples compared with data reproduced from ref. 14. Reduced thickness pushes NC to C phase transition to lower temperature.

