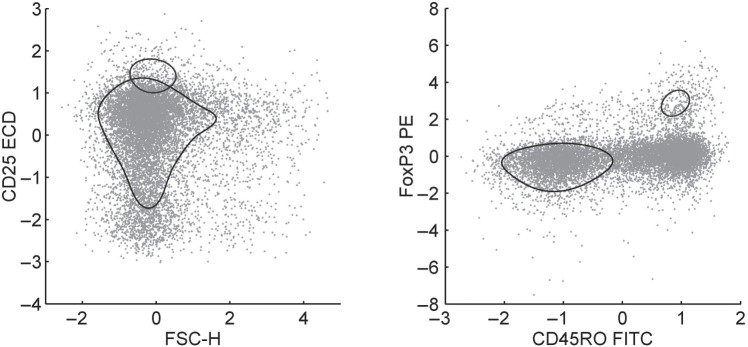
Fig. 2.
Scatter plots of standardized flow cytometry levels for 4 of the 12 marker variables, showing a randomly selected subsample of 10,000 cells. To highlight basic aspects of the mixture model analysis, the scatters are overlaid with contours of the corresponding two-dimensional margins of the two mixture components with highest estimated probabilities. Purely for display here, the specific estimate of the pdf is based on the mixture model with plug-in parameters defined by the posterior mode computed using the Bayesian EM algorithm, followed by component aggregation to identify the non-Gaussian subtypes displayed. The area of each contour displayed is approximately proportional to the corresponding posterior modal estimate of the resulting component probabilities.

