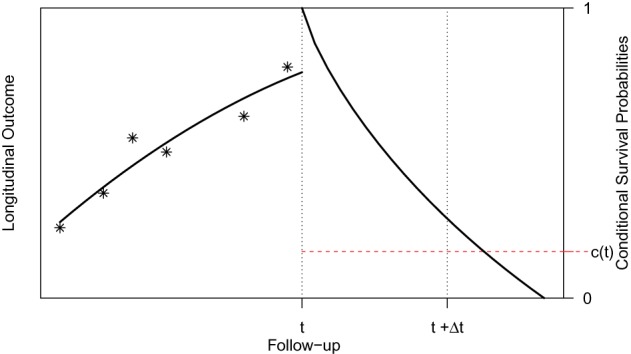
Fig. 1.

Illustration of a patient's longitudinal profile up to time  , and conditional
survival function for whom we wish to plan an extra measurement. Physicians
are interested in events occurring within the time interval
  . Constant
  defines the
threshold above which the physician requires extra information before making a
decision.
