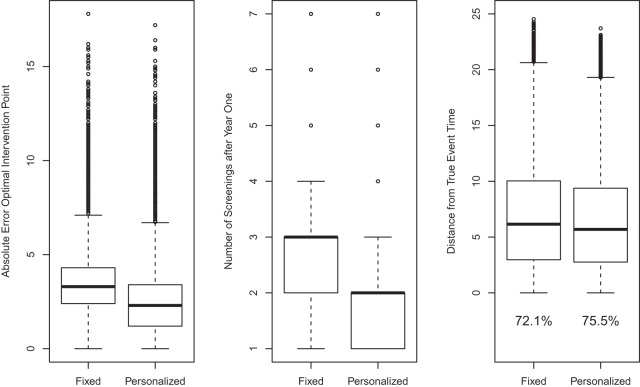
Fig. 2.
Simulation results based on 500 datasets comparing the fixed-planning and personalized screening strategies. Left panel: absolute error between the optimal intervention time point and the time point suggested by the two screening strategies. Middle panel: number of screenings after year 1 required by the two strategies. Right panel: positive distances between the true event time of each patient and the intervention point suggested by each strategy; below the boxplots the percentage of positive differences is shown (i.e. the percentage of patients for whom the intervention time was earlier than the true event time).

