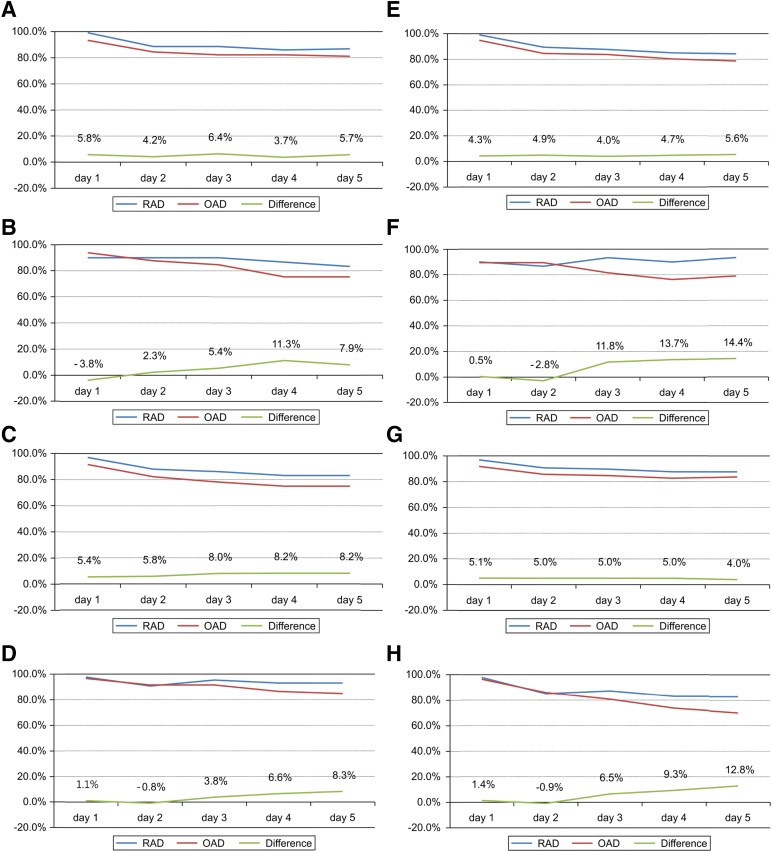
Figure 2.
Subgroup analyses of the complete response rate between the RAD and OAD group. In the modified intention-to-treat population (n = 299). The data were stratified for gender (male [A], female [B]), age (<65 years [C], ≥65 years [D]), chemotherapeutic agent (cisplatin-based [E], non-cisplatin-based regimen [F]), and schedule of chemotherapy (single-day chemotherapy [G], multiple-day chemotherapy [H]). RAD was noninferior to OAD in all subgroups except female. (A): Difference, 10.2%; 90% confidence interval (CI), 2.8%–17.0%. (B): Difference, −3.0%; 90% CI, −16.2%–10.1%. (C): Difference, 5.4%; 90% CI, −0.1%–10.8%. (D): Difference, 1.1%; 90% CI, −4.4%–6.5%. (E): Difference, 4.3%; 90% CI, 0.6%–7.9%. (F): Difference, 0.5%; 90% CI, −11.7%–12.7%. (G): Difference, 5.8%; 90% CI, −2.1%–13.7%. (H): Difference, 11.5%; 90% CI, 0.9%–22.1%. The risk difference between the two arms was analyzed using the generalized estimating equation model.
Abbreviations: OAD, ondansetron, aprepitant, and dexamethasone; RAD: ramosetron, aprepitant, and dexamethasone.

