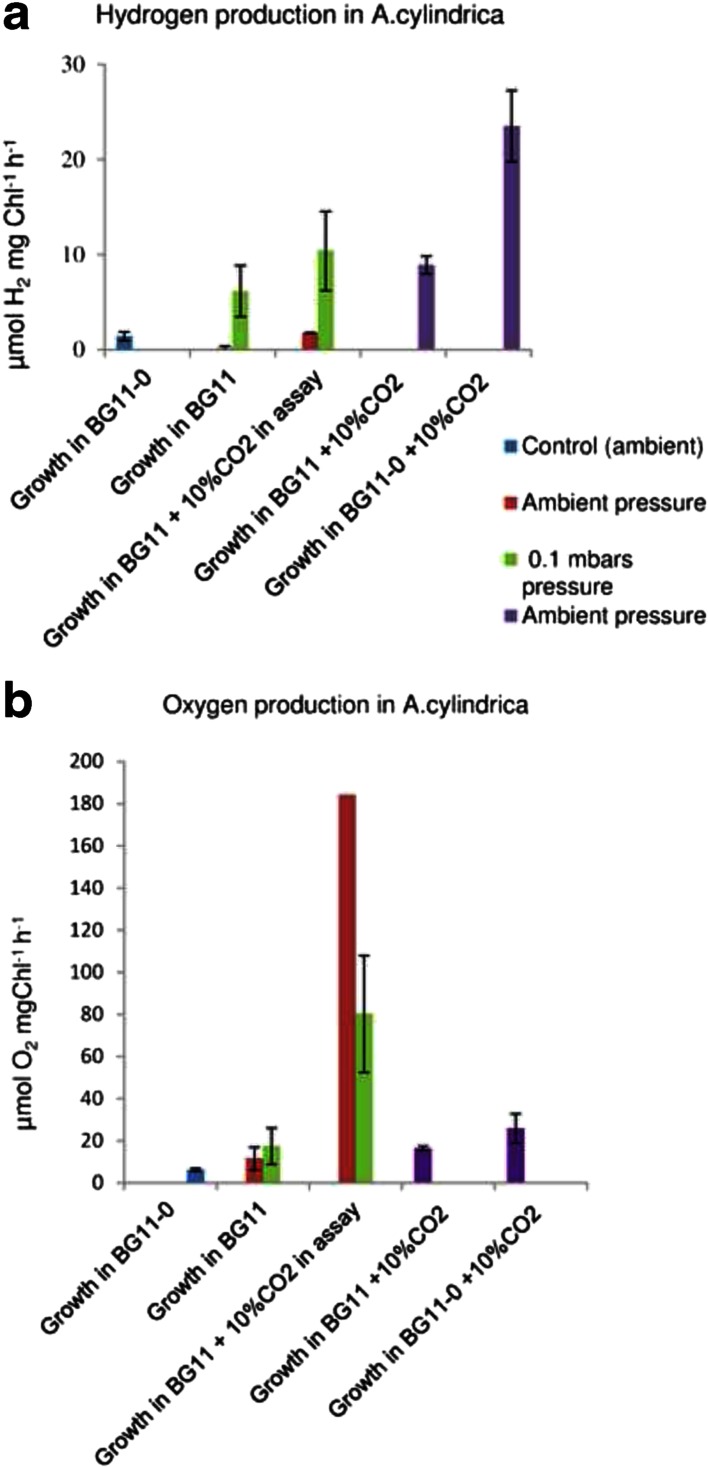
Fig. 5.
Hydrogen (H2) production (a) and oxygen (O2) production (b) of A. cylindrica cells, measured as μmols of H2 or O2 produced / mg Chl a, in 1 h, after 7 days cultivation of cells, using either ambient air pressure, or 100 mbar pressure, and using different CO2 concentrations both in the culture vials, and in the incubation vials (Ar + 10 % CO2) during the gas production, as indicated in the figure. The green bars indicate cultures grown in 100 mbar pressure in 100 % CO2, simulating cultures in pressurized Martian atmosphere. The red and the blue bars indicate control cultures grown in ambient air, and the purple bars indicate cultures grown in ambient air supplemented with 10 % of CO2

