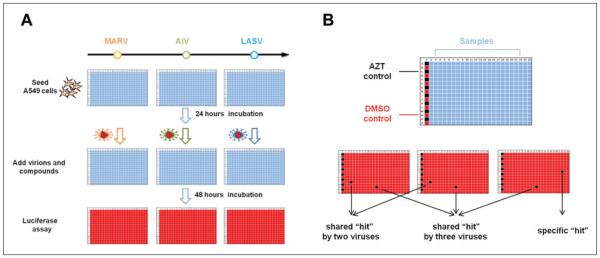
Figure 1.
Experimental design of the comparative high-throughput screening protocol. (A) The comparative compound screen workflow. A549 cells are seeded into 384-well plates and infected by pseudovirions 24 h later in the presence of diverse compounds. After a 48-h incubation, the virus infection is detected by luciferase activity assay. (B) Compound library plate design and data interpretation. Azidothymidine (AZT) controls (black) and DMSO controls (red) are arranged on the first column of the 384-well plate; compounds are arranged in the columns 3 through 22. Compound only showing low signal (black) in assay plate of one type of virus is regarded as this virus’ specific hit; compound showing low signals in assay plates of two different viruses is regarded as the shared hit by these two viruses; compound showing low signals in the assay plates of all three viruses is regarded as a shared hit by three viruses. AIV, avian influenza virus; LASV, Lassa virus; MARV, Marburg virus.

