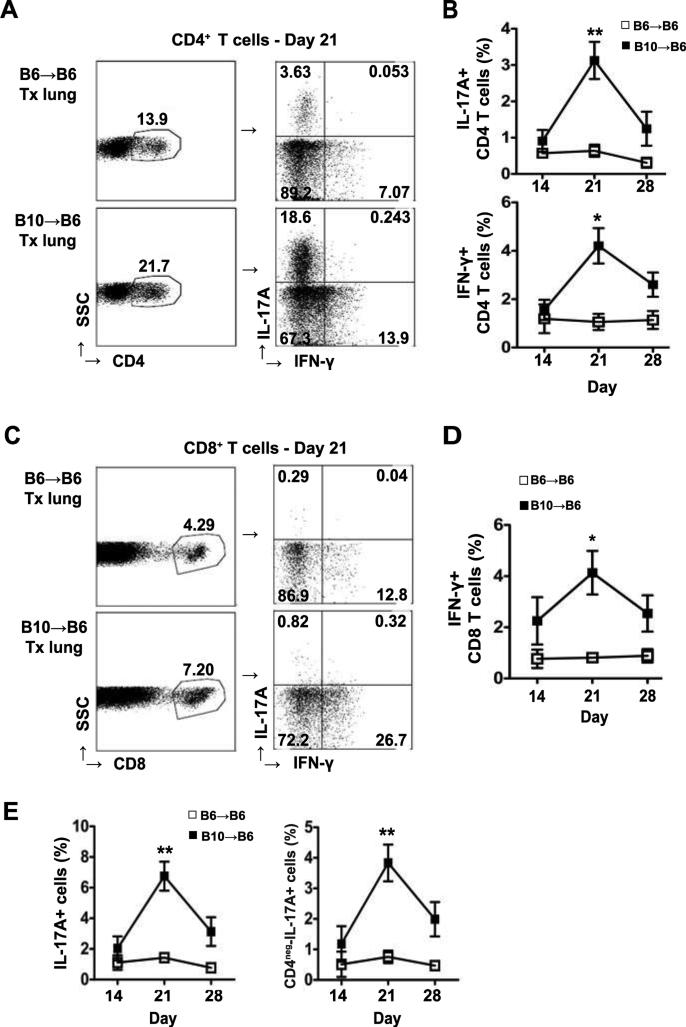
Figure 1. IL-17A and IFN-γ producing T cells are increased in allografts.
Transplanted lungs from B6→B6 and B10→B6 transplants were harvested at different time-points and analyzed by flow cytometry. (A) Representative flow cytometry plots with frequency of IL-17A+ and IFN-γ+ populations (right plot) gated on CD4+ T cells (left plot). (B) Frequency of IL-17A+ and IFN-γ+ CD4+ T cells in lymphocytes gated by size. (C) Representative dot plots with frequency of IL-17A+ and IFN-γ+ populations (right) gated on CD8+ T cells (left). (D) The overall frequency of IFN-γ+ CD8+ T cells in lymphocyte gate. (E) Percentage of IL-17A+ cells (left) and non-CD4 IL-17A+ cells (right) in lymphocyte gate. Number in dot plots represents percentage. For day 14 (n = 2 for B6→B6, n = 4 for B10→B6); day 21 (n = 5 for B6→B6, n = 12 for B10→B6) and day 28 (n = 3 for B6→B6, n = 5 for B10→B6). For IFN-γ+CD4+ and IFN-γ+CD8+ T cells, n=4 for B6→B6 at day 21. Data were analyzed by unpaired t test compared to B6→B6 at same time-point, *P<0.05, **P<0.01.

