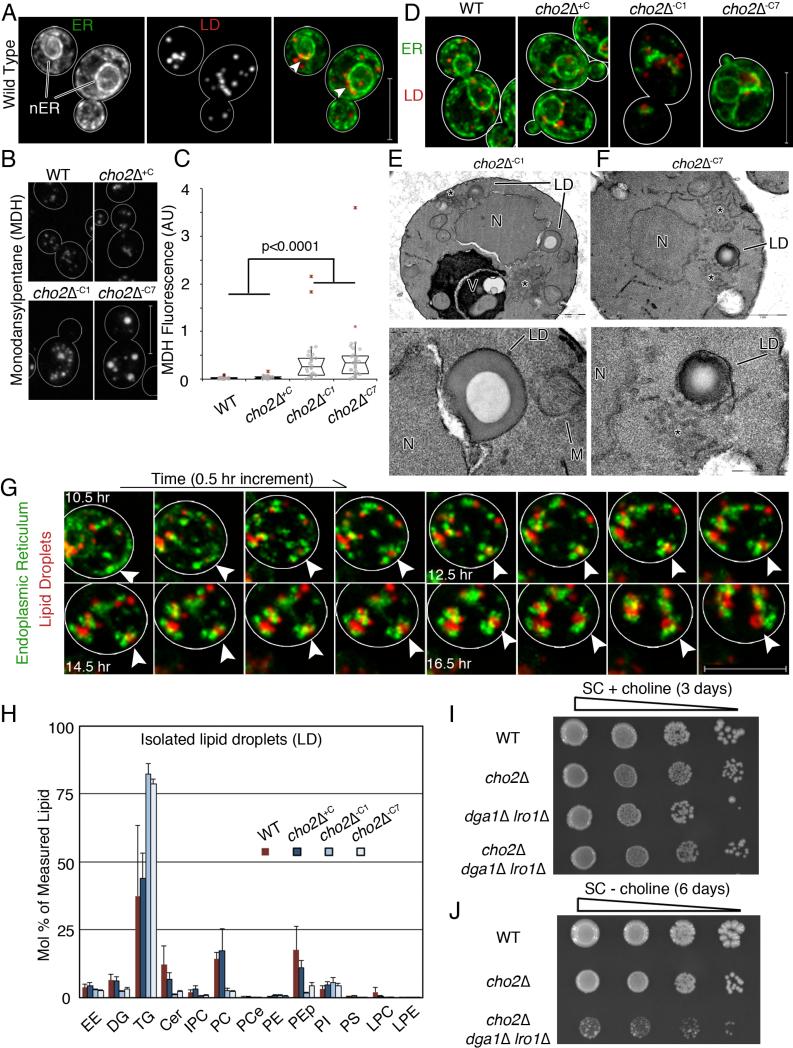
Fig 4. Lipid droplet biogenesis occurs at ER aggregates and is required for adaptation to lipid imbalance.
(a) Maximum projections of cells expressing Pho88p-GFP and Erg6p-mCherry. Arrow heads point to areas near the nucleus where LDs accumulate. Bar: 5 μm (b) Representative images of MDH-stained LDs. Bar: 5 μm. (c) Notched dot box plot of cellular MDH fluorescence. P-values from Kruskal-Wallace test with Bonferroni correction. 1 of 3 representative trials is shown, n>25 cells for each condition. (d) Representative images of ER and LDs during lipid imbalance. Bar: 5μm. (e-f) TEM of a cho2Δ cell, N: nucleus. LD: lipid droplet. V: Vacuole. LDs have a characteristic “donut” staining pattern. Asterisk marks abnormal membrane aggregates. Bottom panels show enlarged views of LDs in the respective top panels. Bar: 1 μm (d-e top), 200 nm (d bottom), 500 nm (e bottom). (g) Representative time-lapse frames of ER and LDs in a cho2Δ cell after transfer to choline-free medium. Arrow heads point to the same spot in all images. Bar: 5 μm. (h) Lipids analyzed as in Fig. 1 are represented as mean +/− SEM. (i) Dot assay of serially diluted (1:10) strains on SC + choline media. (j) Dot assay of serially diluted (1:10) strains grown to mid-log phase in choline-containing media and plated on choline-free SC media. See also Figure S4.

