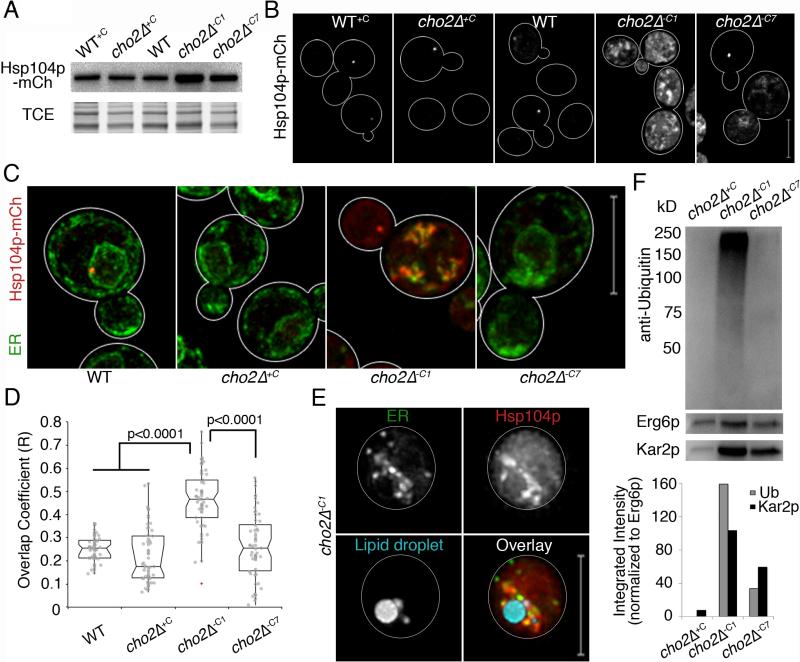
Fig. 6. Chaperone proteins are recruited to ER aggregates and LD fractions are enriched in ubiquitinated proteins.
(a) Western blot of Hsp104p-mCh. TCE: load control. (b) Maximum projections of Hsp104-mCh. (c) Representative images of Pho88p-GFP and Hsp104-mCh. (d) Notched dot box plots of colocalization between ER and protein aggregate fluorescence in (c) using Manders’ overlap coefficient (R). P-values from Kruskal-Wallace test with Bonferroni correction. n>50 for each condition. (e) Representative images of cells as in (c) with LDs labeled with MDH. Bar: 5 μm. (f) Upper panel: Representative western blot of ubiquitinated proteins in LDs isolated as in Fig. 4h. LDs isolated from cho2Δ+C cells were used as controls. Erg6p-mCh was used as a loading control. Blots were also probed for Kar2p as an internal ER chaperone. Lower panel: Quantitation of ubiquitin and Kar2p levels normalized to Erg6p levels. 1 representative trial is shown from 3 independent trials fpr all experiments. All scale bars: 5 μm. See also Figure S6.

