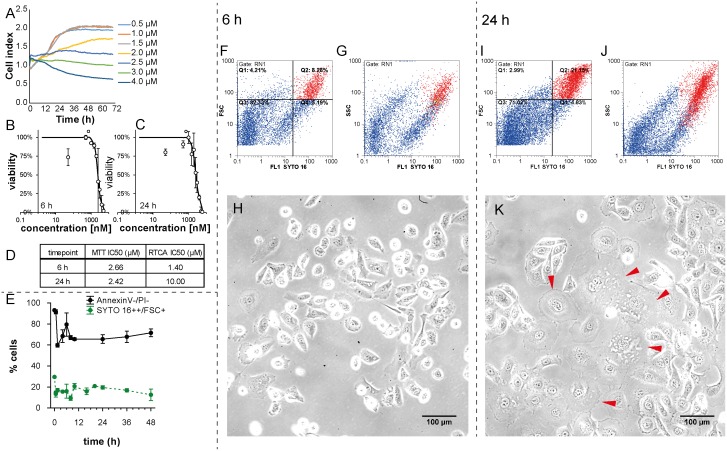
Fig 1. Effect of plumbagin treatment on viability and size of cells.
(A) Real-time monitoring of relative cell impedance (showed as a cell index) using the RTCA system. (B) MTT-assessed response to 6h plumbagin treatment. (C) MTT-assessed response to 24h plumbagin treatment. (D) IC50 values according to RTCA and MTT and length of treatment. (E) Time-dependent changes in the quantity of large cells with intact nuclei (SYTO 16++/FSC+) and intact cells (AnnexinV-/PI-) assessed by flow-cytometry. (F) Numbers of large healthy cells depicted as SYTO 16++ /FSC+ (red) cluster at flow-cytometric dot plot at 6h time-point; Forward-scattered light (FSC) is proportional to cell-surface area or size. (G) Granularity of large healthy cells depicted as SYTO 16++ /SSC+ (red) cluster at flow-cytometric dot plot at 6h time-point; Side-scattered light (SSC) is proportional to cell granularity or internal complexity. (H) Morphology of PC-3 cells after 6h plumbagin treatment, 20x magnification, phase contrast microscopy. (I) Numbers of large healthy cells depicted as SYTO 16++/FSC+ (red) cluster at flow-cytometric dot plot at 24h time-point; Forward-scattered light (FSC) is proportional to cell-surface area or size. (J) Granularity of large healthy cells depicted as SYTO 16++/SSC+ (red) cluster at flow-cytometric dot plot at 24h time-point; Side-scattered light (SSC) is proportional to cell granularity or internal complexity. (K) Morphology of PC-3 cells after 24h plumbagin treatment; giant PC-3 cells with polyploid giant cancer cell (PGCCs)-like morphology are highlighted by arrows. 20x magnification, phase contrast microscopy.

