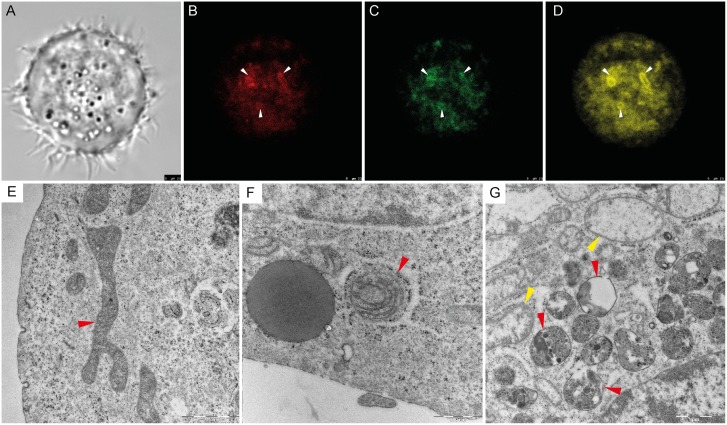
Fig 2. Reactive oxygen species (ROS)-induced mitophagy.
(A) Phase contrast microscopy of PC-3 cell after plumbagin treatment. (B) General accumulation of ROS after plumbagin treatment monitored by confocal microscopy by using CellROX Deep Red Reagent. Areas with ROS accumulation are highlighted by arrows. (C) Mitochondria staining monitored by confocal microscopy using MitoTracker Green; area associated with ROS in Fig 2B are highlighted by arrows. (D) Endoplasmic reticulum (ER) staining monitored by confocal microscopy using ERTracker Red; areas associated with ROS in Fig 2B are highlighted by arrows. (E) Untreated PC-3 cell, cross-section of undamaged mitochondria (highlighted by red arrow); Transmission Electron Microscope (TEM) visualization. (F) plumbagin-treated PC-3 cell, mitochondria coated by ER membrane with ribosomes (highlighted by red arrow); TEM visualization. (G) Plumbagin-treated PC-3 cell, gradual degradation of mitochondria in autophagosomes visualised by TEM (red arrows); Swollen mitochondria as a marker of damage (yellow arrow).

