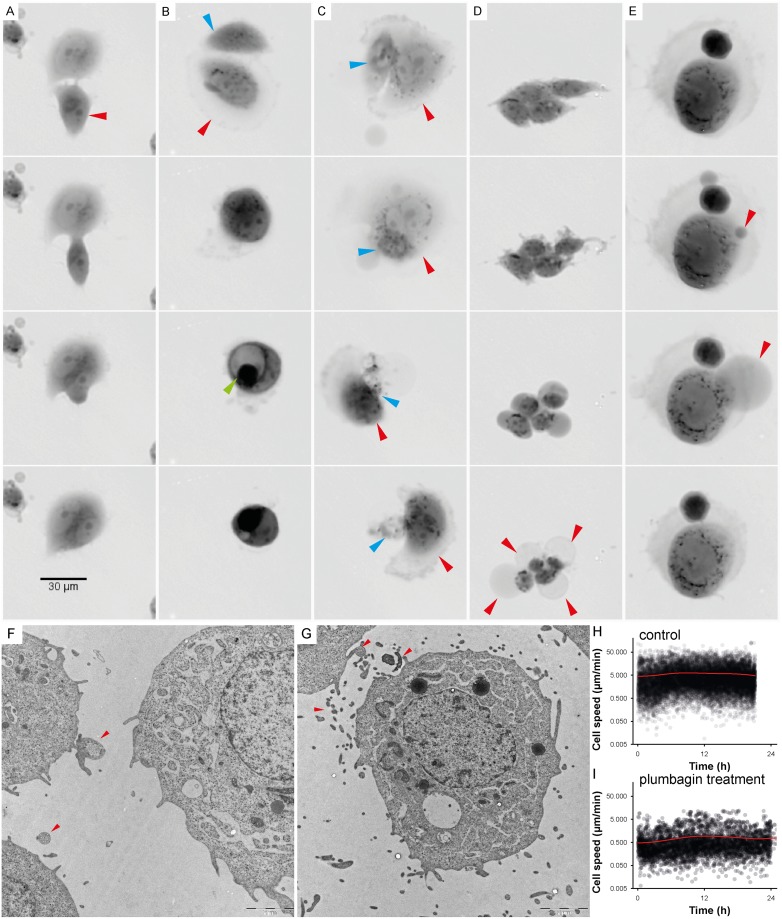
Fig 3. Time-lapse of cell interactions.
For detailed time-lapse Videos see S1–S4 Videos. (A) Time-lapse imaging of entosis; internalized cell (red arrow) played an active role in its engulfment, which resulted in complete internalization. Both types of cells (engulfing and engulfed) were viable for a long time and lived by about five hours longer than the other observed plumbagin-treated tumour cells. (B) Time-lapse imaging of cell fusion with cannibalism (digestion of engulfed cell); during fusion-cannibalism of living cells, the cannibalic cell (red arrow) came in contact with the target cell (blue arrow). The next step was gradual engulfment of the target cell. The nucleus of the target cell appeared initially unaltered whereas the engulfing cell’s nucleus began to change into a semilunar shape. Bird eye structure was observed as a consequence of target cell vacualisation (see green arrow). (C) Time-lapse imaging of cannibalism without fusion; the dying cell (blue arrow) was attacked and exploited by the cannibalic cell (red arrow). The target cell was dead after the attack. (D) Time-lapse imaging of oncosis; oncotic cells formed typical cytoplasmic blebs that usually lead to necrosis (see red arrow). (E) Time-lapse imaging of reverse oncosis; initial forming of oncotic blebs (see red arrow) did not lead to necrosis; the bleb was absorbed and the cell remained viable. (A-E) Multimodal holographic microscopy, 10x magnification. (F) Communication between PC-3 cells; visualised by TEM (see red arrows). (G) Vesicular transfer between PC-3 cells; visualised by TEM (see red arrows). (H) Speed of the migration of untreated PC-3 cell population; assessed from holographic microscopy data by CellProfiller software by measurement of “distance travelled”parameter. (I) Speed of the migration of PC-3 cell population after 2 μM plumbagin treatment.

