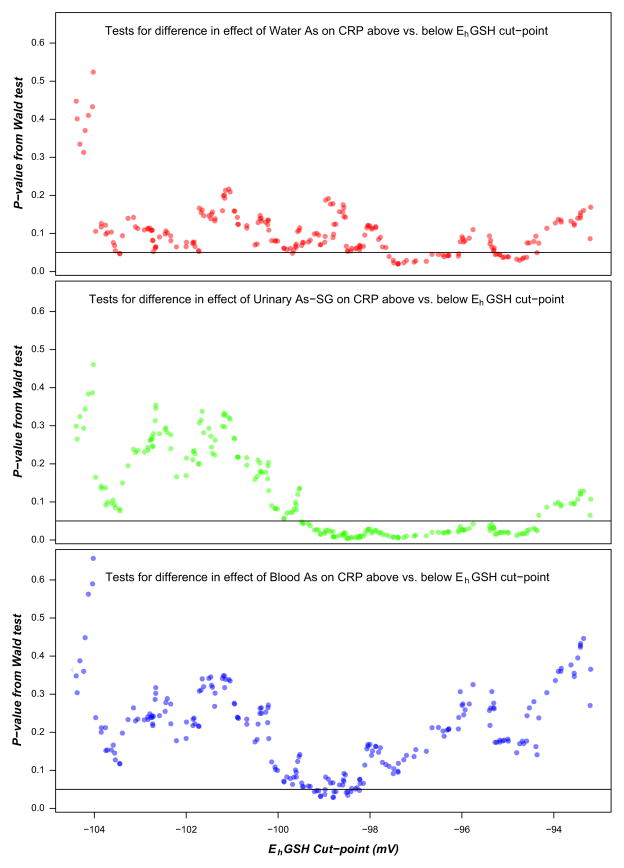
Fig. 2.
Plots of p values from Wald tests for the difference in the effect of log(water As) (top), log(urinary As-SG) (middle), or log(blood As) (bottom) on log(CRP) between more and less oxidized groups, defined by different plasma EhGSH cut-points. The effect of As exposure was the regression coefficient of the As variables adjusted for log (age), log(BMI), and sex.

