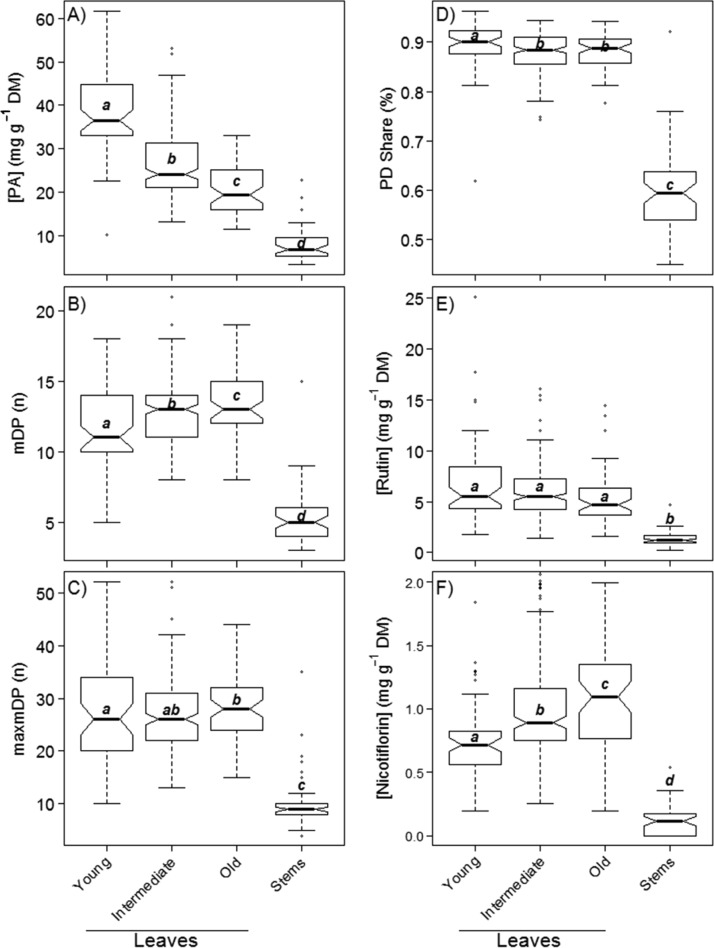
Figure 2.
(A) Proanthocyanidin concentration [PA], (B) mean degree of polymerization (mDP), (C) maximum degree of polymerization (maxmDP), (D) share of prodelphinidins (PD), (E) rutin concentration, and (F) nicotiflorin concentration in leaves of different ages and stems. Boxes display medians (bold line), the first and third quartile (lower and upper line of box), and whiskers extending to the most extreme data point, which is <1.5 times the interquartile range. Different letters among medians indicate significant differences at P ≤ 0.05.

