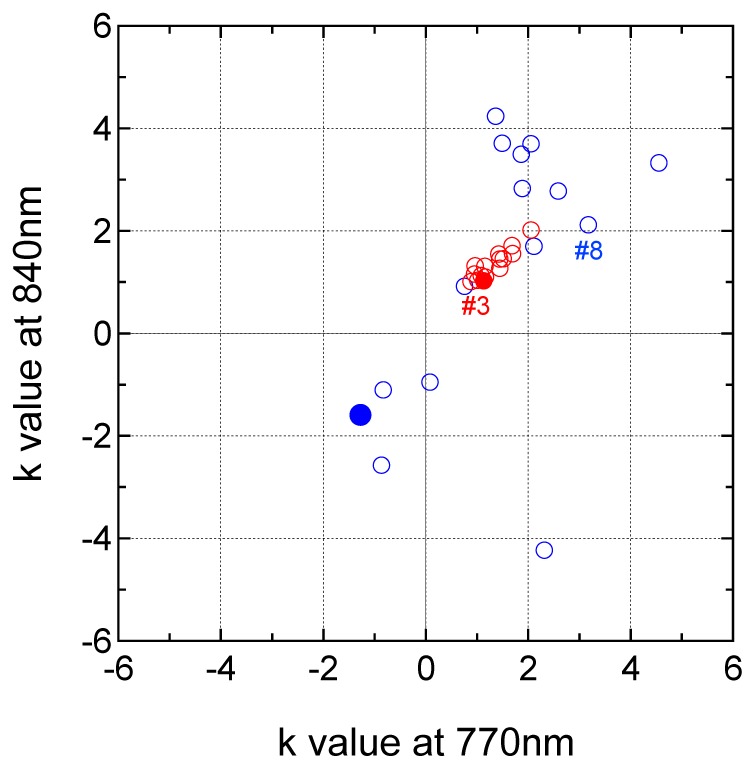
Fig. 9.

Difference in k values estimated with the proposed and original multidistance technique. Red and blue circles represent values with the arrangements S3-S1-D1 and S3-S2-D2, respectively. The filled circle in each color corresponds to the cases shown in Figs. 6 and 8. Circles of the best cases in artifact reduction used the proposed (#3) and the original (#8) multidistance measurements were indicated with colored letters, respectively.
