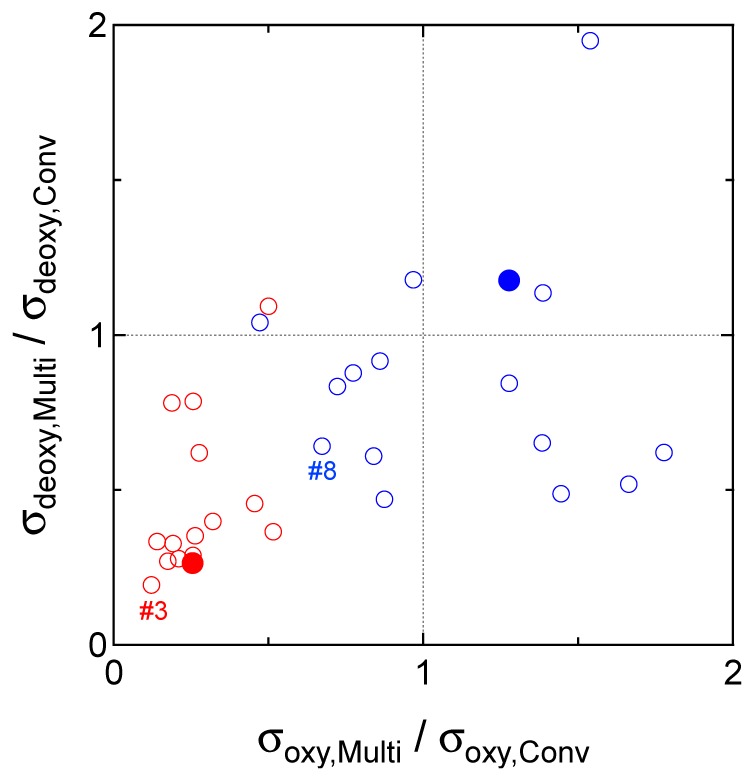
Fig. 10.

Improvement in baseline flatness evaluated by the relative reduction ratio of standard deviation in hemoglobin changes calculated with the multidistance arrangement technique. Red and blue circles represent values obtained with arrangements S3-S1-D1 and S3-S2-D2, respectively. The filled circle in each color corresponds to the cases shown in Figs. 6 and 8. Circles of the best cases in artifact reduction used the proposed (#3) and the original (#8) multidistance measurements were indicated with colored letters, respectively.
