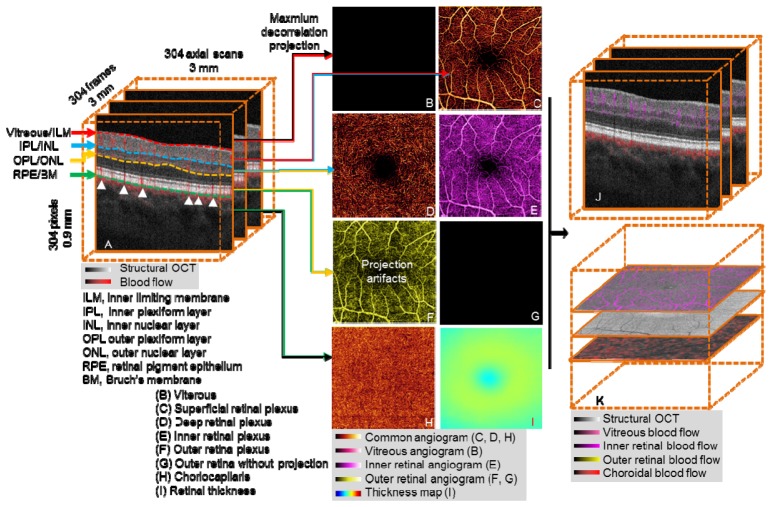
Fig. 1.
Overview of OCT angiography image processing of a healthy macula. (A) The 3D OCT data (3 × 3 × 0.9 mm), after motion correction with structural information overlaid on angiography data. OCT angiogram is computed using the SSADA algorithm. (B-I) After segmentation of the retinal layers, 3D slabs are compressed to 2D and presented as en face maximum projection angiograms. (B) The vitreous angiogram shows the absence of flow. (C) The superficial inner retinal angiogram shows healthy retinal circulation with a small foveal avascular zone. (D) The deep inner retina angiogram shows the deep retinal plexus which is a network of fine vessels. (E) Inner retinal angiogram. (F) The healthy outer retinal slab should be absent of flow, but shows flow projection artifacts from the inner retina. (G) The outer retinal angiogram after projection removal (F minus E). (H) The choriocapillaris angiogram. (I) Retinal thickness map segmented from vitreous/ILM to RPE/BM, the color bar range is 0 to 600 μm. (J) Composite structural and angiogram B-scan images generated after removal of shadowgraphic projection. (K) Composite C-scan images generated by the flattening of OCT structural and angiogram data volume using RPE/BM.

