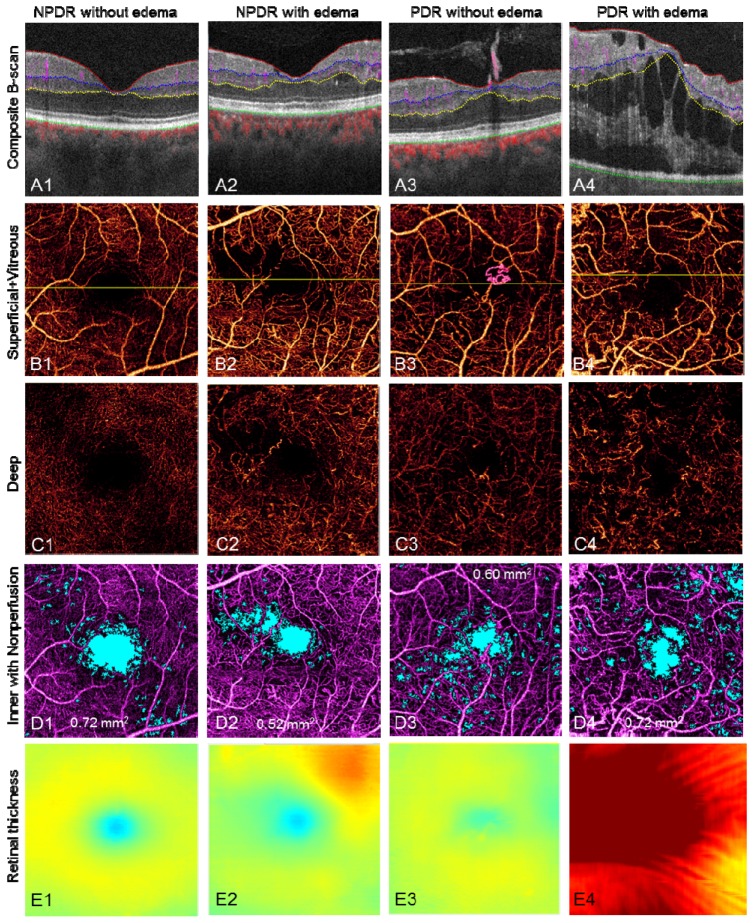
Fig. 11.
Representative results of DR cases. The scan size is 3 × 3 mm. (Row A) Edema, cyst, extrudes, RNV, and blood flow in different layers can be visualized on the composite B-scan images. (Row B) The composite en face angiogram of superficial inner retina and vitreous, where the RNV can be easily seen as pink vessels. The yellow line in row B marks the position of the B-scan slices in row A. (Row C) The angiogram of the deep inner retina. The vascular network is different from the superficial inner retina, although there are projection artifacts from the superficial inner retina. (Row D) shows the angiogram of inner retina with nonperfusion areas marked in light blue. The nonperfusion areas are 0.72 mm2, 0.52 mm2, 0.60 mm2, and 0.72 mm2, respectively. (Row E) The retinal thickness, i.e. the distance from Vitreous/ILM to RPE/BM. The color map is the same as in Fig. 1(I).

