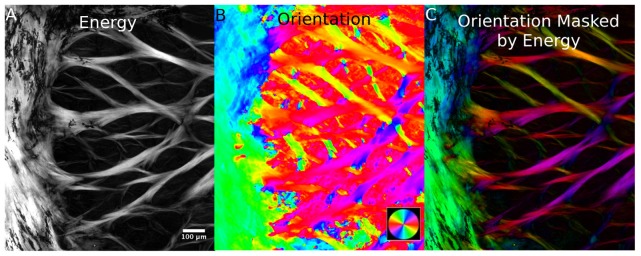
Fig. 2.
Example results in a region of the peripheral lamina cribrosa and sclera. The main output from our technique was a local (pixel) measure of orientation (B). In a direct plot of orientation it is difficult to distinguish the structures of interest. To improve visualization, we also computed for each pixel the energy, as defined in the main text (A). The energy was then used to scale the brightness of the orientation maps producing an image of orientation “masked by energy” (C). This image allows easily discerning the trabecular structure of the lamina cribrosa simultaneously with the collagen fiber orientation. For clarity, all other orientation images in this manuscript are shown masked. Analyses were done with unmasked orientations.

