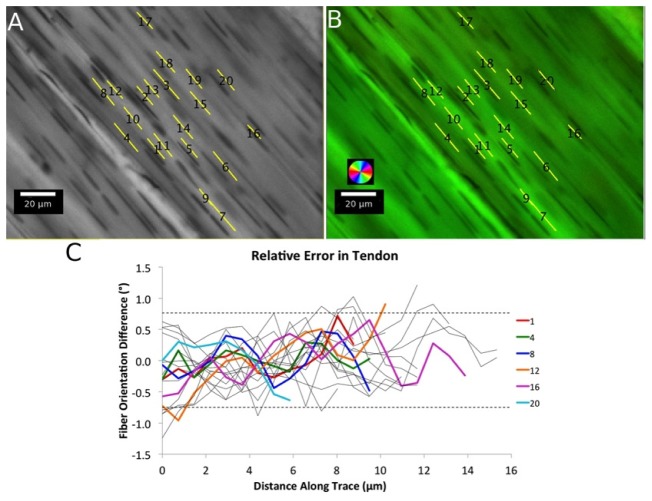
Fig. 4.
Accuracy in loaded tendon tissue. Using images of loaded tendon (A), we compared PLM orientation (B) with orientation of manual traces. The relative error was small for all 20 traces (C). For clarity, six traces were highlighted in color, with the rest shown in grey. The dotted lines represent the 2.5th and 97.5th percentiles of the orientation differences.

