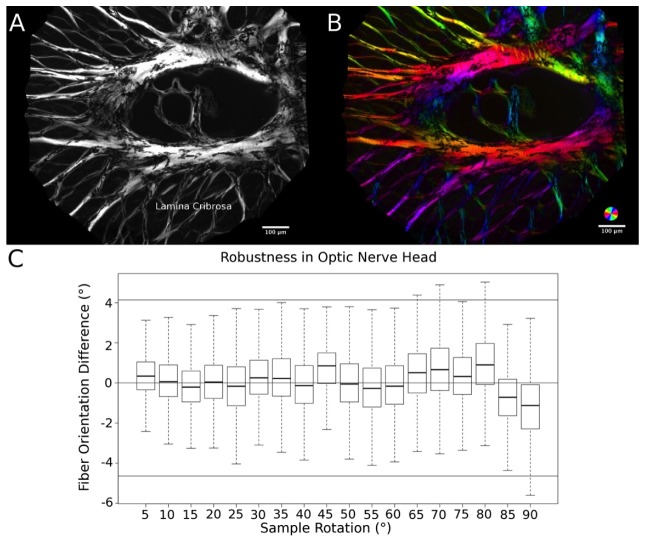
Fig. 8.
Robustness in optic nerve head tissue. Image sets of sheep lamina cribrosa were taken (A) and for each set the fiber orientation was calculated (B) (see Visualization 1 (1.3MB, AVI) ). The tight distributions through the different sample rotations show that our measurements are highly robust (C). The solid lines above and below represent the 2.5th and 97.5th percentiles of the orientation differences.

