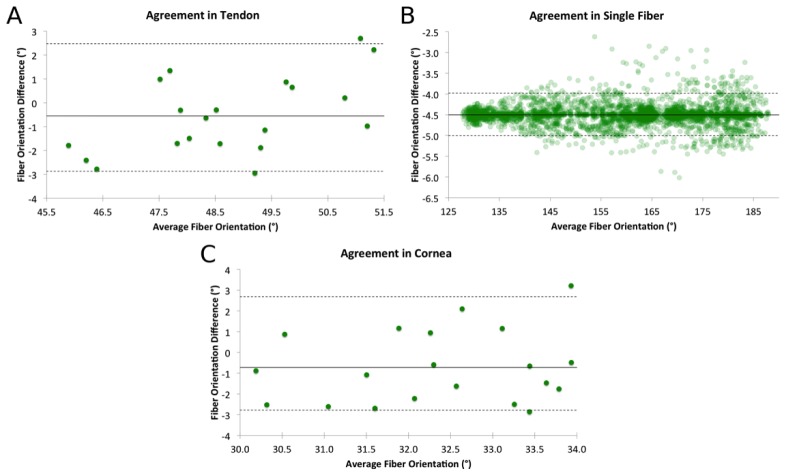
Fig. 12.
Bland-Altman plots of the agreement between manual markings and PLM orientation measurements in tendon (A), a single curved fiber (B), and cornea (C). For the tendon and cornea tests, the mean PLM orientation for each line was used to construct the plot whereas every point was used for the single fiber. The dotted lines represent the 2.5th and 97.5th percentiles of the orientation differences. We note that since our goal was to determine whether the two measurement methods (manual and PLM) produced the same results, a mixed effects model was not the appropriate analysis tool. Using a mixed effects model would have required us to define apriori a criteria for measurements to be the same. Instead of making such an arbitrary call, we present the results as obtained and show agreement.

