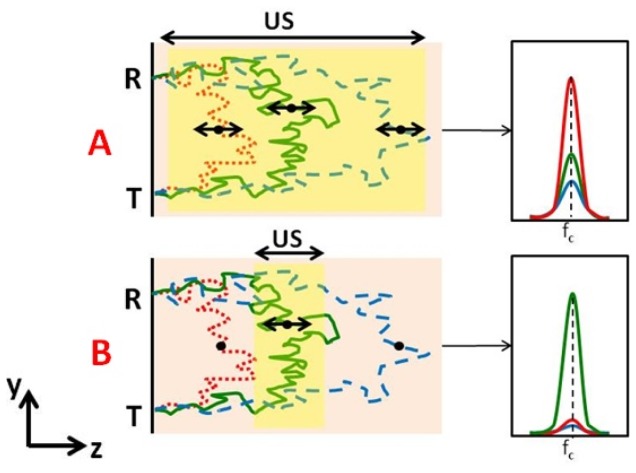
Fig. 1.
Different light paths propagate thorough different depths inside the sample (examples in red, green, blue) and their corresponding spectra around US frequency (fc). Black points designate typical scattering sites along the different paths. T & R stands for the light transmission and reception points, respectively. (A): The red path represents the most probable path for the given geometric configuration. As paths get longer, their probability gets smaller (green) and smaller (dashed blue). When a continuous ultrasound (US) wave is used for modulating the entire tissue volume of the “banana” defined by the transmission and reception points - the overall spectral distribution which is sum of three spectra “types” (colors) will normally be dominated by “red” type paths (right). (B): In the case where an US pulse modulates only a specific volume (overlapping mainly with “green” type paths), then the spectrum is dominated by these paths. Shorter “red” type are almost not modulated while longer “blue” type will be less expressed due to their relatively smaller probability and smaller US overlap.

