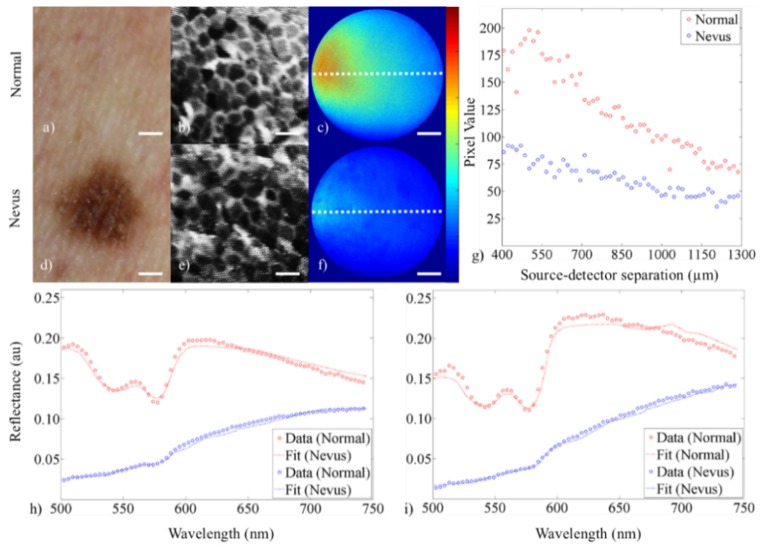
Fig. 6.
Demonstration of technique showing data from (a-c) human healthy skin tissue and (d-f) adjacent melanocytic nevus. The figure shows (a, d) a digital image of the healthy skin and adjacent melanocytic nevus (scale bar = 1 mm), (b, e) cropped and enhanced high-resolution fluorescence images after topical staining with pyranine-derived highlighter ink (scale bar = 50 µm), (c, f) sDRIM data (scale bar = 225 µm, color bar = 0-225), (g) quantification of the sDRIM data taken across the face of the image fiber (400-1,300 µm SDS from 635 nm laser source), (h) broadband sDRS data (374 µm SDS), and (i) broadband sDRS data (730 µm SDS). Raw data are shown as dots and the LUT-based inverse model fits are shown as a curve.

