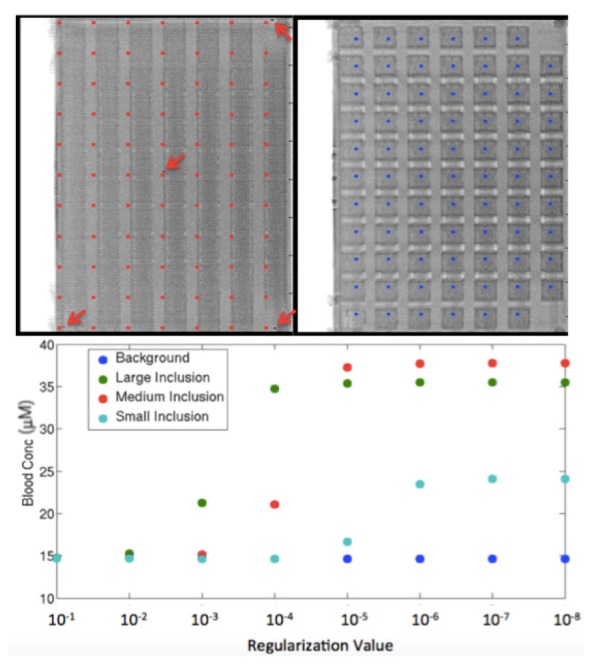
Fig. 2.

DBT reconstruction slice corresponding to the height of the top of the optical phantom (left) with arrows pointing to metal markers of a few directly visualized source positions with the source positions marked in red. A DBT slice corresponding to the level of the detectors (right) with blue markings at the modeled detector locations. Graph shows dependence of inclusion HbT estimates with decreasing regularization.
