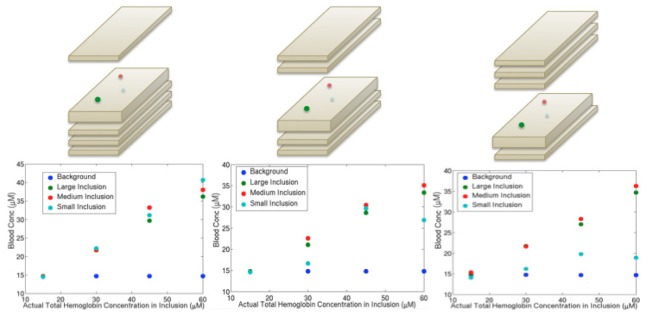
Fig. 3.
Graphs depicting hemoglobin recovery vs. actual hemoglobin concentration for the background and inclusions of different sizes at three different depths. Pictorial demonstrations of the phantom set up are shown above each graph. The slab with inclusions was 2 cm thick and slabs without inclusions were 1 cm thick

