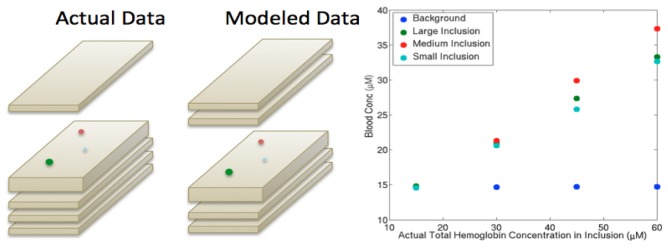
Fig. 4.
Data from a phantom with actual inclusions positioned below a 1 cm slab on the top of the phantom (left picture) but modeled as below 2 cm of homogeneous background (right picture). The hemoglobin estimates are plotted (right graph) and can be compared with the left graph in Fig. 3, which uses the same data but correctly models the inclusion depths.

