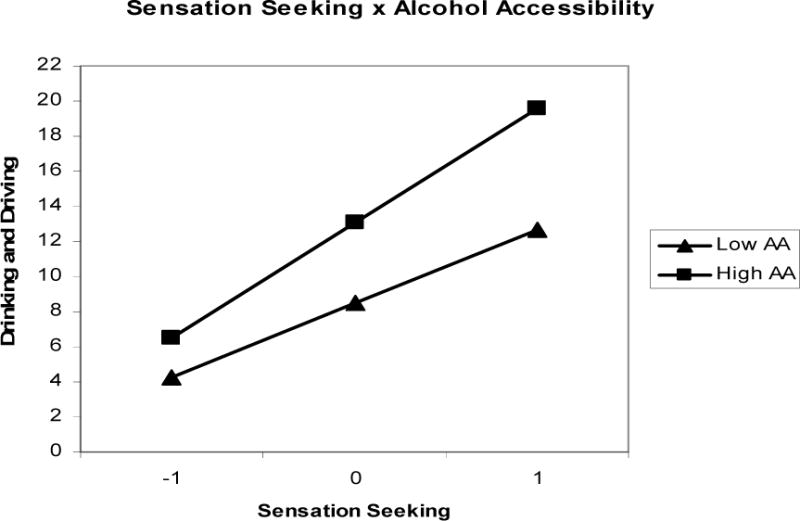
Figure 2.

Graph represents the interaction of sensation seeking with alcohol accessibility from Poisson regression analyses for frequency of drinking and driving. Lines depict predicted rate differences at 1 SD above/below the mean for alcohol accessibility. p < .001.
