Figure.
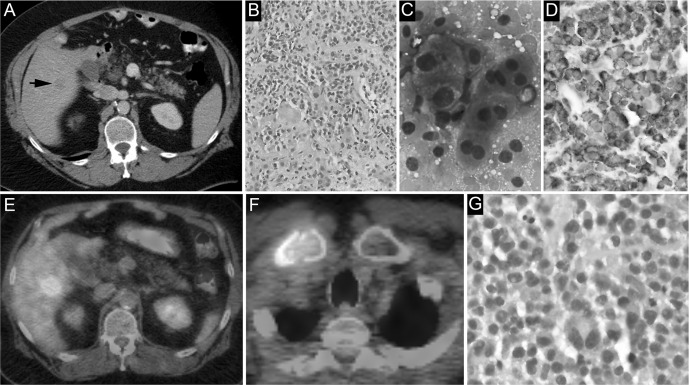
A: The lesion is barely visible on contrast-enhanced computed tomography scan (arrow). B: Core sections of an ultrasound-guided liver biopsy show confluent expansile sheets of plasma cells (hematoxylin and eosin [H&E] stain, ×20). C: Touch imprints of the liver biopsy reveal discohesive plasmacytoid cells and naked nuclei (Diff-Quik stain, ×100). D: Chromogenic in situ hybridization analysis demonstrates cytoplasmic kappa light chain restriction (immunohistochemical stain, ×40). E: Metabolically active lesions in the right hepatic lobe can be seen on positron emission tomography. F: Metabolically active lesions in the right clavicle can be seen on positron emission tomography. G: Core sections of right clavicular bone marrow biopsy show sheets of plasma cells (H&E stain, ×40).

