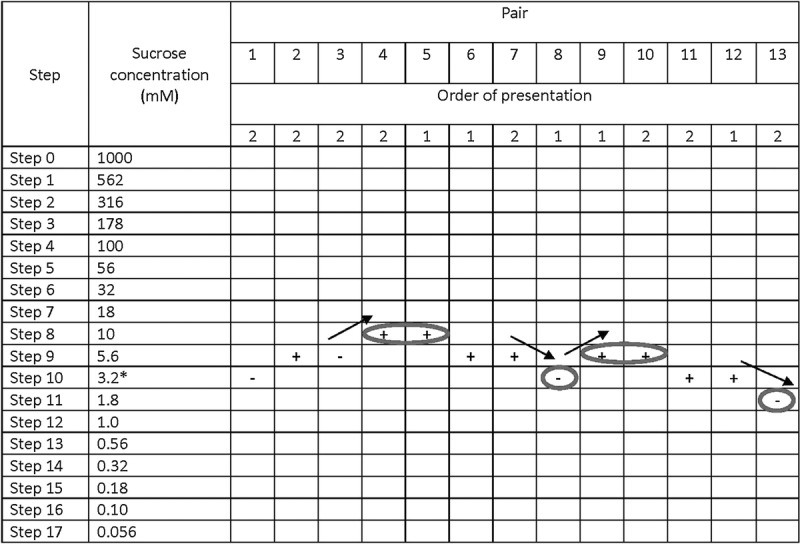
FIGURE 1.

The tracking grid used in the paired comparison method to determine sucrose detection thresholds. The order of presentation of pairs of solutions was determined at random (presentation order 1 signifies water is presented first within that particular pair, whereas 2 signifies the solution with a tastant [sucrose] is presented first within that particular pair). Testing began at Step 10, which corresponded to a concentration of 3.2 mM sucrose. Participants were presented with a pair of solutions, asked to taste each solution following the test protocol, and to point to the solution that had a taste. The tracking grid was used to record whether a participant correctly (+) or incorrectly (−) identified the solution with a taste; the concentration of the tastant in the solution presented in the subsequent pair was increased after a single incorrect response and decreased after two consecutive correct responses. Testing continued until the participant attained four reversals in performance (circled and marked with arrows to indicate the direction of reversal); a participant’s threshold for a tastant was calculated as the mean of the log values of the last four reversals. In this example, the participant’s molar concentrations for each reversal were 10, 3.2, 5.6, and 1.8 mM. Thus, the calculation is [((−2.00) + (−2.49) + (−2.25) + (−2.74)/4)] = −2.37. We computed the antilog, which is ~4.2 mM.
